
For the elite website designer, SEO is your best chum. You are well acquainted with the broad and extensive field of knowledge and strategies known as Search Engine Optimization, a true art form, that you have passionately honed and cultivated for assured success in any online-facing enterprise.
For those of us who orbit slightly below this exosphere, a number of initiatives have sprung up, some of which, like Google Web Vitals, have the express purpose to “simplify the landscape” by allowing us to trivially measure and monitor a growing array of page performance metrics.
Split Suite automatically captures these performance measurements without needing any additional configurations like a third-party integration. Using Split Suite is the most efficient path to getting Instant Feature Impact Detection (IFID). With IFID, you can swiftly catch any issue that impacts application performance or user behavior with pinpoint precision and unmatched speed. This eliminates the manual effort of detecting, triaging and resolving issues to radically reduce mean time to detect (MTTD) and get to mean time to resolve (MTTR). Something to envy–even for the gurus–and you’ll still have time to go out and play with your kids.
In this article, you’ll see how easy it is to measure your features against performance metrics, so you can quickly detect impact and rollback back to safety within seconds if needed. We’ll also uncover a few gold nuggets in Split’s Measurement and Learning capabilities along the way.
Overview of the Journey
Using our multipage example on github and an automation script, we will visualize real-time data for Core Web Vitals and activate feature-specific alerting to enforce degradation thresholds that provide you with the agility to guarantee a great experience for your users.
To embark on this journey, you will need:
- A Split account (with the Measurement and Learning add-on) or switch on a free account today.
- Visual Studio Code
- The NPM package manager
That’s not much, so let’s begin!
Setting Up Split Suite With a Few Lines of Code
The Split Suite for Web & Mobile SDKS is now live, and it’s the most efficient path to getting Instant Feature Impact Detection.
The Split Browser SDK Suite makes it trivial to start recording webpage performance measurements and creating metrics in Split UI. Simply configuring Split Suite sets up the Split RUM Agent internally. You’ll find the fully updated example using Split Suite on Github.
import { SplitSuite } from '@splitsoftware/browser-suite';

const client = SplitSuite({
    core: {
      authorizationKey: process.env.CLIENT_SIDE_SDK_KEY,

      // In this example, we get the user key from URL query parameter `id`
      key: new URLSearchParams(window.location.search).get('id'),
      // Specifying the traffic type for the user key is optional, the value is 'user' by default
      trafficType: 'user'
    }
  }).client();
Notice that we pass a user ID value as the key to Split Suite. This user ID is what ties everything together for Split, and allows for data analysis and intelligent alerting so you can sleep restfully and react appropriately. We will come back to examine this gleaming nugget in Visualizing Metrics below.
What this code does: The Split RUM Agent is automatically configured within Split Suite to gather Performance API Navigation Timing and Web Vitals page metrics for you, using the Performance API and Web Vitals libraries internally. With the above lines of code, you have just hooked up all the instrumentation needed to professionally measure modern website performance. When we set up our feature flags in Split, these measurements become feature-informed data that makes the difference in crafting your website performance strategy.
Setting Up Feature Flags in Split UI
Log in or sign up to a Split account and set up three feature flags to support our example, as shown below. P.S. You’ll notice that my Split UI screenshots are in dark mode and that’s because I use a dark mode browser extension. Split currently doesn’t support dark mode in its product today but you can get this experience, if you like, by installing a simple extension in your browser.
network_speed feature flag definition:
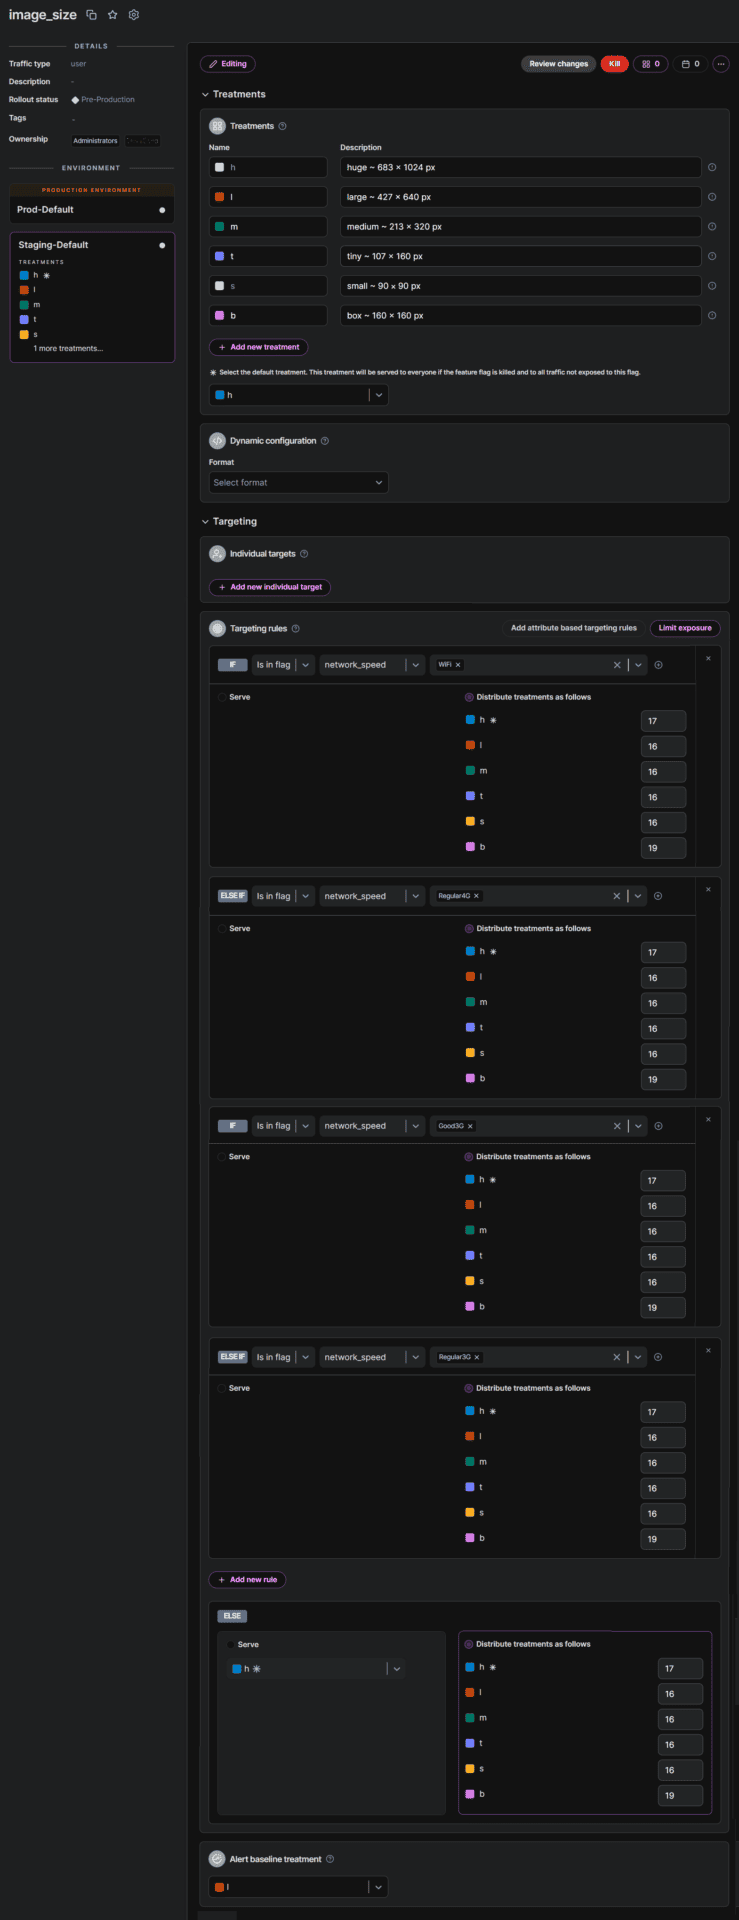
image_size feature flag definition:
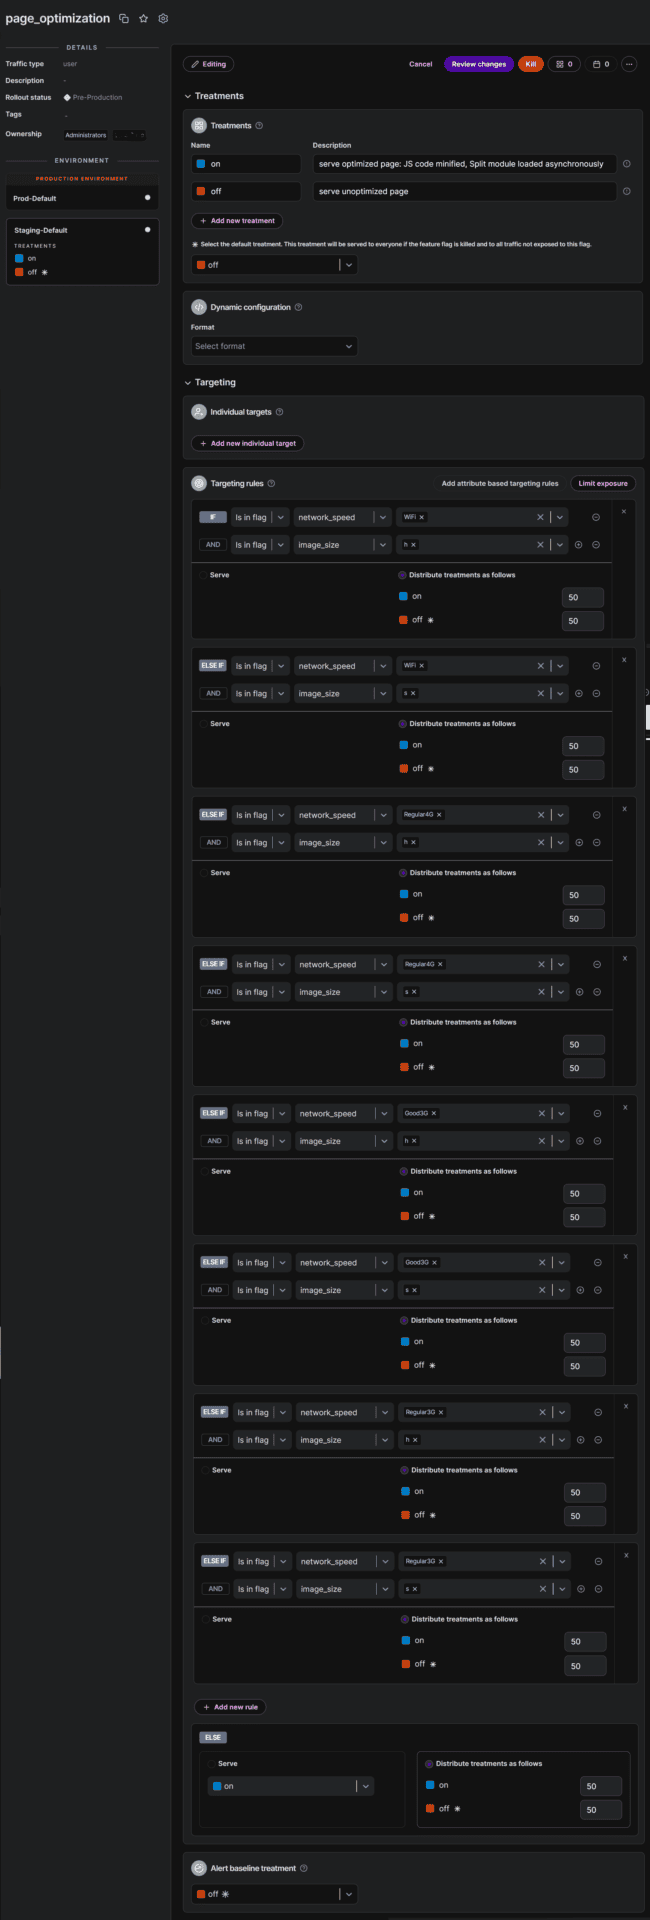
page_optimization feature flag definition:
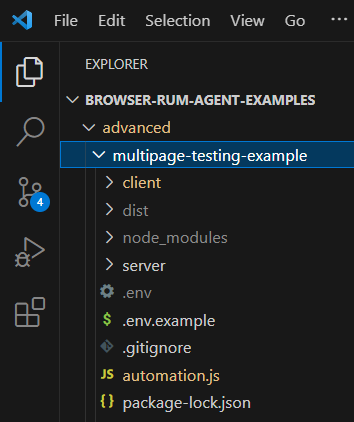
Next, let’s fire up Visual Studio, clone our github repository using the url https://github.com/splitio/browser-rum-agent-examples.git, and navigate to the advanced/multipage-testing-example folder:
Copy the .env.example file and rename the copy to .env. It should have the following content:
CLIENT_SIDE_SDK_KEY=YOUR_CLIENT_SIDE_SDK_KEY
SERVER_SIDE_SDK_KEY=YOUR_SERVER_SIDE_SDK_KEY
FEATURE_FLAG_OPTIMIZE_PAGE=page_optimization
FEATURE_FLAG_NETWORK_SPEED=network_speed
FEATURE_FLAG_IMAGE_SIZE=image_size
You can get your SDK keys from your Split Admin settings page. In Split UI, click the top button in the left navigation panel, select Admin settings, select API keys, and click the SDK API Keys tab.
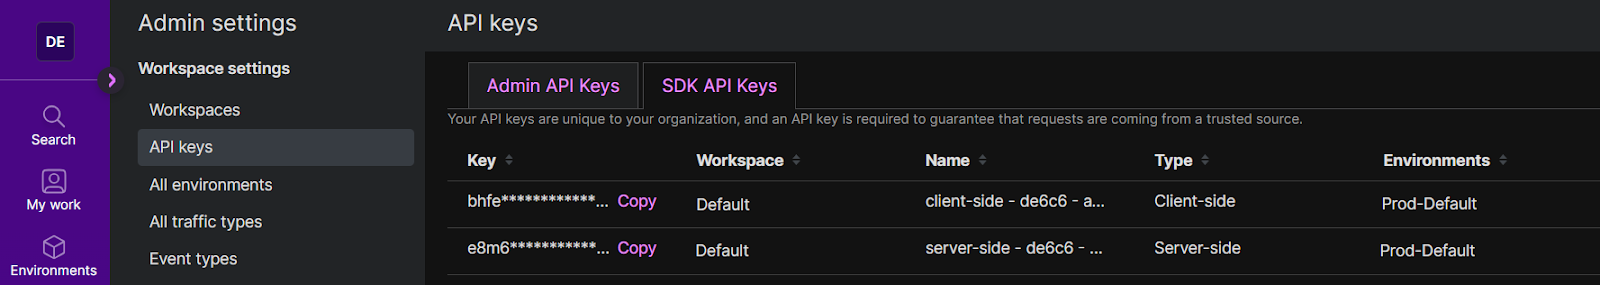
You will need to copy and paste your client and server-side API key values into your .env file.
Having set up your .env file values, we are ready to send webpage performance measurements to Split, for some useful feature-centric analysis.
Viewing Events in Split UI
To prepare to see events received by Split, let’s navigate to Data hub in Split UI. Select Events in the Data type dropdown and click the Query button.
Now in Visual Studio, open a new terminal window and run the following commands:
cd .\advanced\multipage-testing-example
npm install
npm run serve
This sets up the project and starts the website. You can test that the site is running by navigating to http://localhost:3000/?id=0. Try passing in a few different id values while keeping a watchful eye on Data hub. You should see your measurements coming in, as shown in the animated gif below.
You can pause the Live tail and click on a user id (as shown below) to see that the user already has a treatment assigned for each feature flag.
In the above example, the user identified by the value 9 will always be exposed to the m, Regular3G, and on treatments.
This is a gold nugget where Split shines, and a key concept for crafting your releases: Since you set up the Split RUM agent to accept the user id, your measurements are combined with feature and behavioral data.
Here’s how this works in detail: Split links each event (using the user identifier) to the treatment of each feature flag. As different users visit your page, new event-to-feature-flag correlations are added. This data is collected and monitored so that you can observe how an observed event is affected by a feature, especially a notable degradation or improvement in an event, such as a vital webpage measurement. Something you want to know about.
Automatically Created Web Page Performance Metrics
When you click on a feature flag, and select the Metrics impact tab, at this point, you will see metric cards already created, as shown.
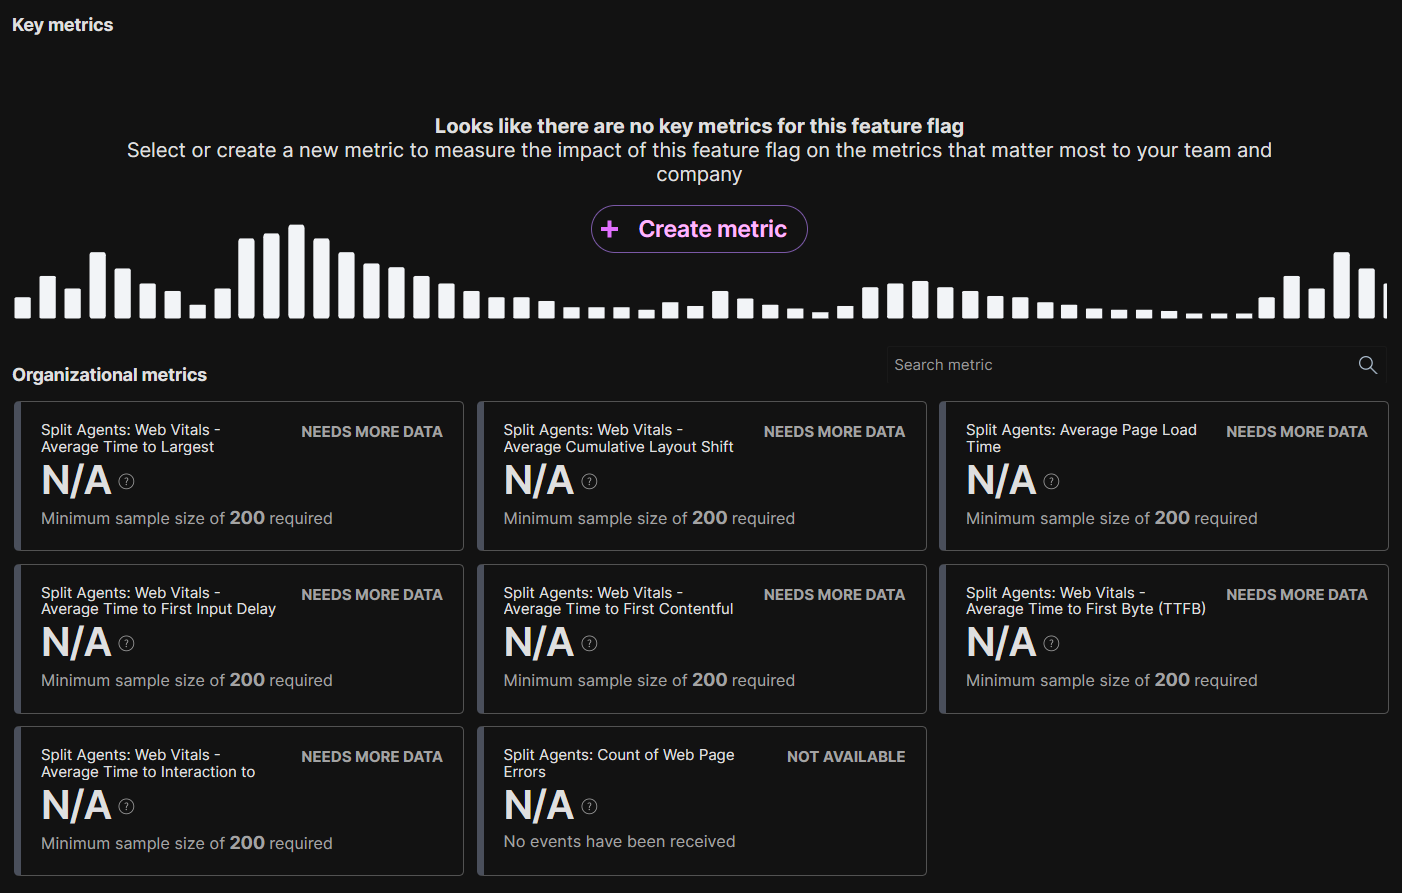
For this demo, we will focus on measuring the current Core Web Vitals (and recommended values):
- Largest Contentful Paint (LCP) < 2.5 seconds
- First Input Delay (FID) < 100 ms
- Cumulative Layout Shift (CLS) < 0.1
You can see that the metric cards display ‘Needs more data.’ We’ll feed the data into Split, but let’s first just take a moment to set up a metric alert.
To truly release confidently, sleep soundly, and have your weekends back, we’ll need to make good use of metric alerts. We’ve set ourselves up to demonstrate this essential component of Instant Feature Impact Detection, as we’ll soon see.
Hover over the Split Agents: Web Vitals – Average Cumulative Layout Shift metric card, click More actions and select Manage alert policies.
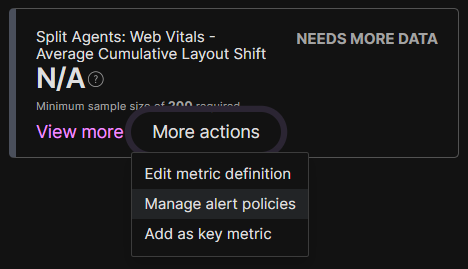
Click Create alert policy, and define a metric alert as shown below.
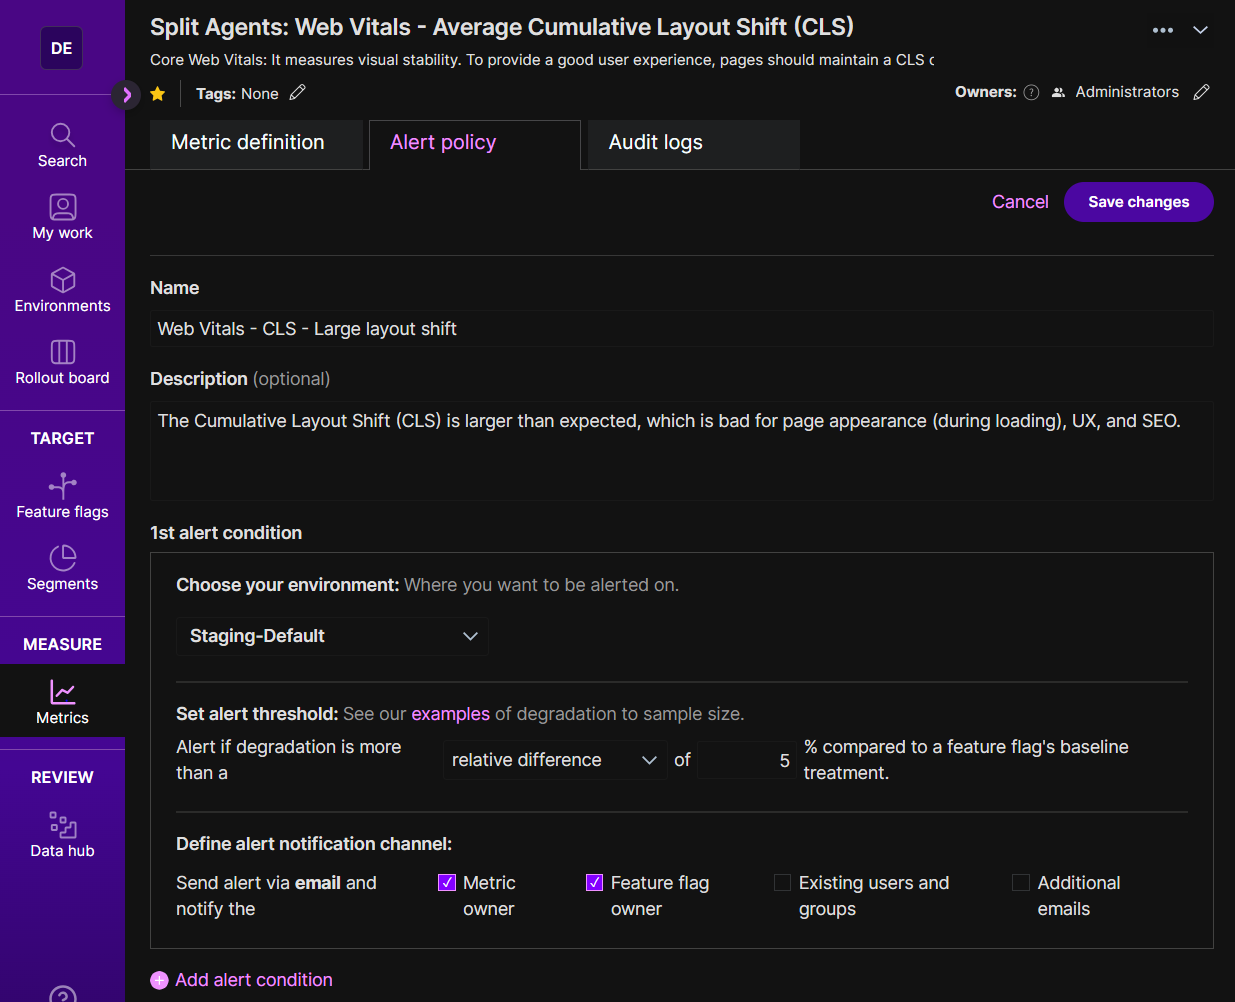
You’ll notice that Split’s alerting engine will now check for a 5% degradation in the webvitals.cls measurement that the metric measures.
For the first 24 hours (the default Monitor window) after our feature flags are created, the Split alerting engine will periodically compare each treatment (since they are distributed by percentage in the targeting rules) in our feature flags against the baseline treatment of the same flag. We will see an email when a treatment performs poorly (by 5% or more) compared with the baseline, but only after both these treatments meet the Minimum sample size. For this reason, let’s set the smallest possible minimum sample size for one of our flags. You can do this after clicking on the Experiment settings page of the image_size feature flag’s Metrics impact tab, and first selecting Sequential testing for the Testing method.
Automating Web Page Performance Measurement Testing
We will run our automation script to populate our data.
From a terminal in Visual Studio, enter the following command: npm run automation 0 500. That will test your first five hundred unique user ids. You can split the terminal and add concurrent test automations for the next five hundred unique ids, and so on. With three thousand ids tested you’ll have plenty of data for demonstrating metrics impact. Our results are below.
Receiving a Metric Alert
If you’ve been closely following this tutorial, you may have noticed how we set up one of our metrics definitions a little strangely (to orchestrate an alert). If not, take a quick look at the definitions again under Setting Up Feature Flags in Split UI. Notice anything odd in the image_size feature flag definition?
Yup, you got it! The baseline treatment for the image_size feature flag is not the smallest image size. As our page requests run and Split runs its scheduled recalculations during the monitor window, the Split alerting engine will send out four email alerts, similar to the one shown below.
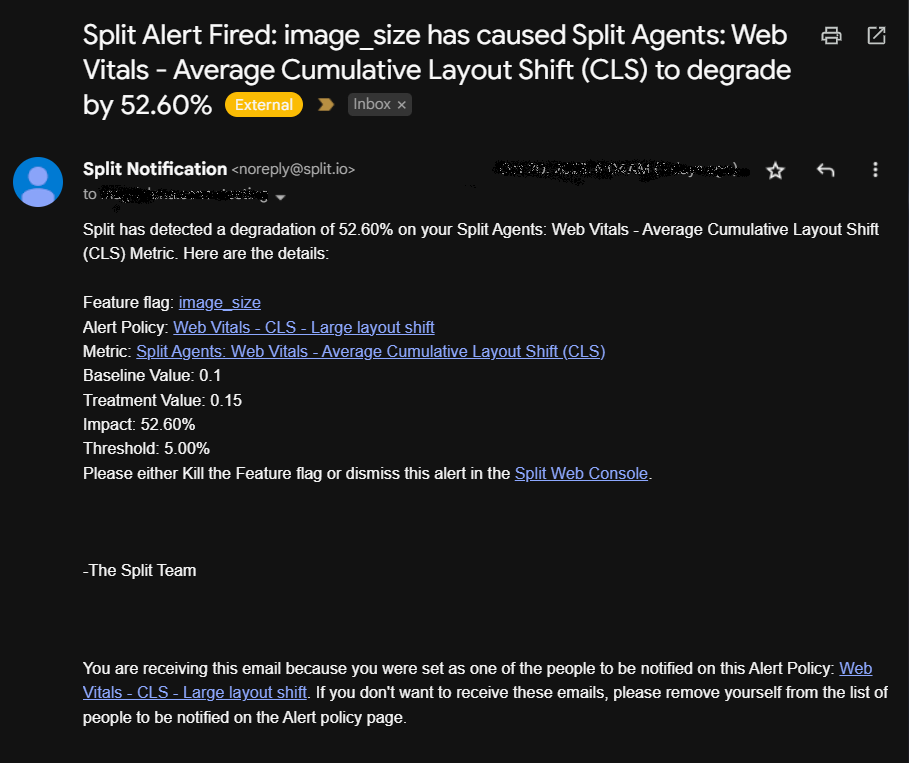
You’ll notice that the email identifies the feature flag that triggered the alert and that the CLS value increased from 0.1 to 0.15. This makes sense because our chosen baseline treatment l displays an image of 427 x 640 pixels, while the percentage rollout treatment h (683 x 1024 pixels) will cause a greater visual layout shift (due to larger image size). This degradation triggers the alert, so that you will know about it.
Let’s look at the image_size feature flag Alert tab.
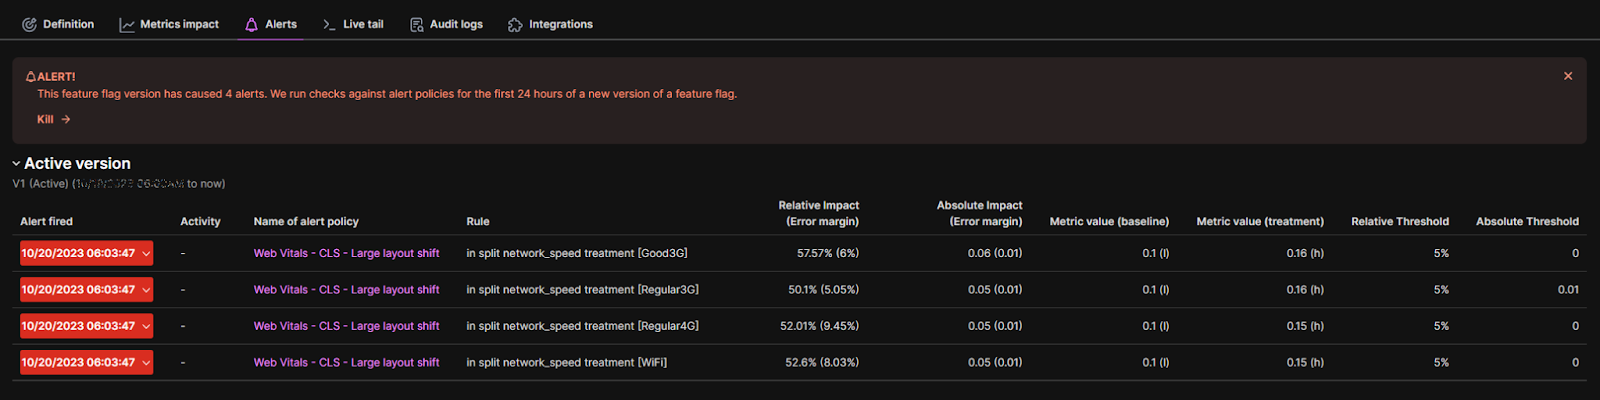
It is obvious that a similar CLS degradation occurs regardless of the network speed, which is expected. There is also an interesting detail that can be very helpful when setting alert thresholds. Notice that the relative impact that we experienced is in the 50-60% range for each alert (well above our 5% relative alert threshold). We can also see the absolute values, based on our data, that these percentages represent. The absolute impact that we experienced is 0.05 or 0.06 (represented by the 50-60% relative impact values). This means that, for the alert threshold, if the alert policy specified an absolute difference (rather than a relative difference) then a value less than or equal to 0.05 would trigger the same four alerts, and if the alert policy had specified an absolute difference of 0.06, then only the first alert would have fired.
When you click Results on the Metrics impact tab, you can view the calculated metric impact between two treatments in a targeting rule. You can also view the absolute measurements by hovering over the (?) on the metric card, as shown.
You’ll notice that we can conveniently compare our results for any treatment with any other in the same targeting rule. As shown in the animation below, this great freedom in experimentation is another gold nugget where Split shines brilliantly, giving you effortless comparisons that provide a complete and thorough understanding of your features’ impact, both in pre-release testing (as demonstrated here) and in production code.
While we have seen an excellent exposition of the effects of image size on Cumulative Layout Shift, the full impact of our experiment is revealed by the page_optimization feature flag. You’ll see why this feature flag is king. Let’s explore our results.
Visualizing Metrics
We’ll see how all our experimental factors affect our Core Web Vitals on the page_optimization feature flag’s Metric impact tab.
(To view the results shown in the video below, we reduced our sample size by setting our Experimental settings to the Fixed horizon Testing method and we waited the 24 hour minimum experimental review period.)
Network speed and image size are both factored into our page optimization feature flag, so this flag unveils important trends: the impact of page optimization grows as network speeds decrease and image size increases. Clicking into the Largest Contentful Paint metrics card shows a time around 2.2 seconds without optimization and 1.6 seconds with page optimization. Our results further reveal an unexpected improvement in Cumulative Layout Shift when serving small images over a slow network.
With such useful statistics and testing results in your pocket, you are well equipped to strategize for SEO and confidently move into production testing, to gain insight into how your users experience your site in the wild.
Wrap Up
We have seen how trivial it is to send web page performance statistics for analysis in Split UI, where you can benefit from excellent measurement and experimentation tools and activate alerting for key performance indicators that pinpoint quick and decisive resolutions.
No matter which SEO sphere of expertise you orbit, Split’s Instant Feature Impact Detection empowers you to confidently deliver the gold standard website user experience, and treat all your visitors as VIPs.
The full code demo is available on github with a low bow of thanks to Emiliano Sanchez, as well as Anita McDowell for the brilliant experimentation insights shared in this post.
Switch It On With Split
The Split Feature Data Platform™ gives you the confidence to move fast without breaking things. Set up feature flags and safely deploy to production, controlling who sees which features and when. Connect every flag to contextual data, so you can know if your features are making things better or worse and act without hesitation. Effortlessly conduct feature experiments like A/B tests without slowing down. Whether you’re looking to increase your releases, to decrease your MTTR, or to ignite your dev team without burning them out–Split is both a feature management platform and partnership to revolutionize the way the work gets done. Schedule a demo to learn more.
Get Split Certified
Split Arcade includes product explainer videos, clickable product tutorials, manipulatable code examples, and interactive challenges.