
If you’ve ever admired superheros, you may have marveled at their uncanny ability to sense danger and to get away just in the nick of time.
What would it take to achieve that in the software management field?
In the software development life cycle, that would take instant feature impact detection, a way to perceive the impact of new software features instantly and to resolve negative impacts with unmatched speed. At Split, this is our superpower and it can be yours.
In this article, we will show you how to implement Instant Feature Impact Detection (IFID) in 5 easy steps.
But let’s first consider why you need IFID. Suppose you are performing a cautious rollout of a cutting-edge feature in your flagship mobile application, starting at 5%. Suppose that unfortunately, the new feature is causing an increase in your crash rate.
What would this look like in Android vitals?
For an app with 10,000 users, a 5% rollout of a new feature that has a 5% crash rate would bring the app’s net crash rate up by 0.25%. On the Google Play Console, the app’s crash rate over time would look like this.
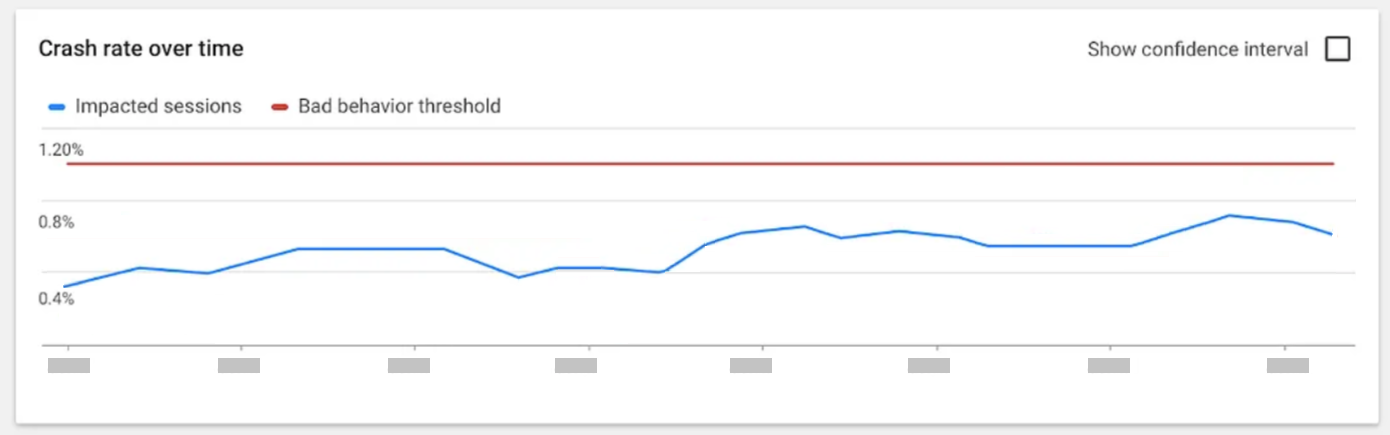
Do you notice anything unusual? It is hard to be sure, much less to take action.
What would this look like in Split?
Split’s sophisticated monitoring engine, effectively heightens your senses and pinpoints the badly behaving feature like this.
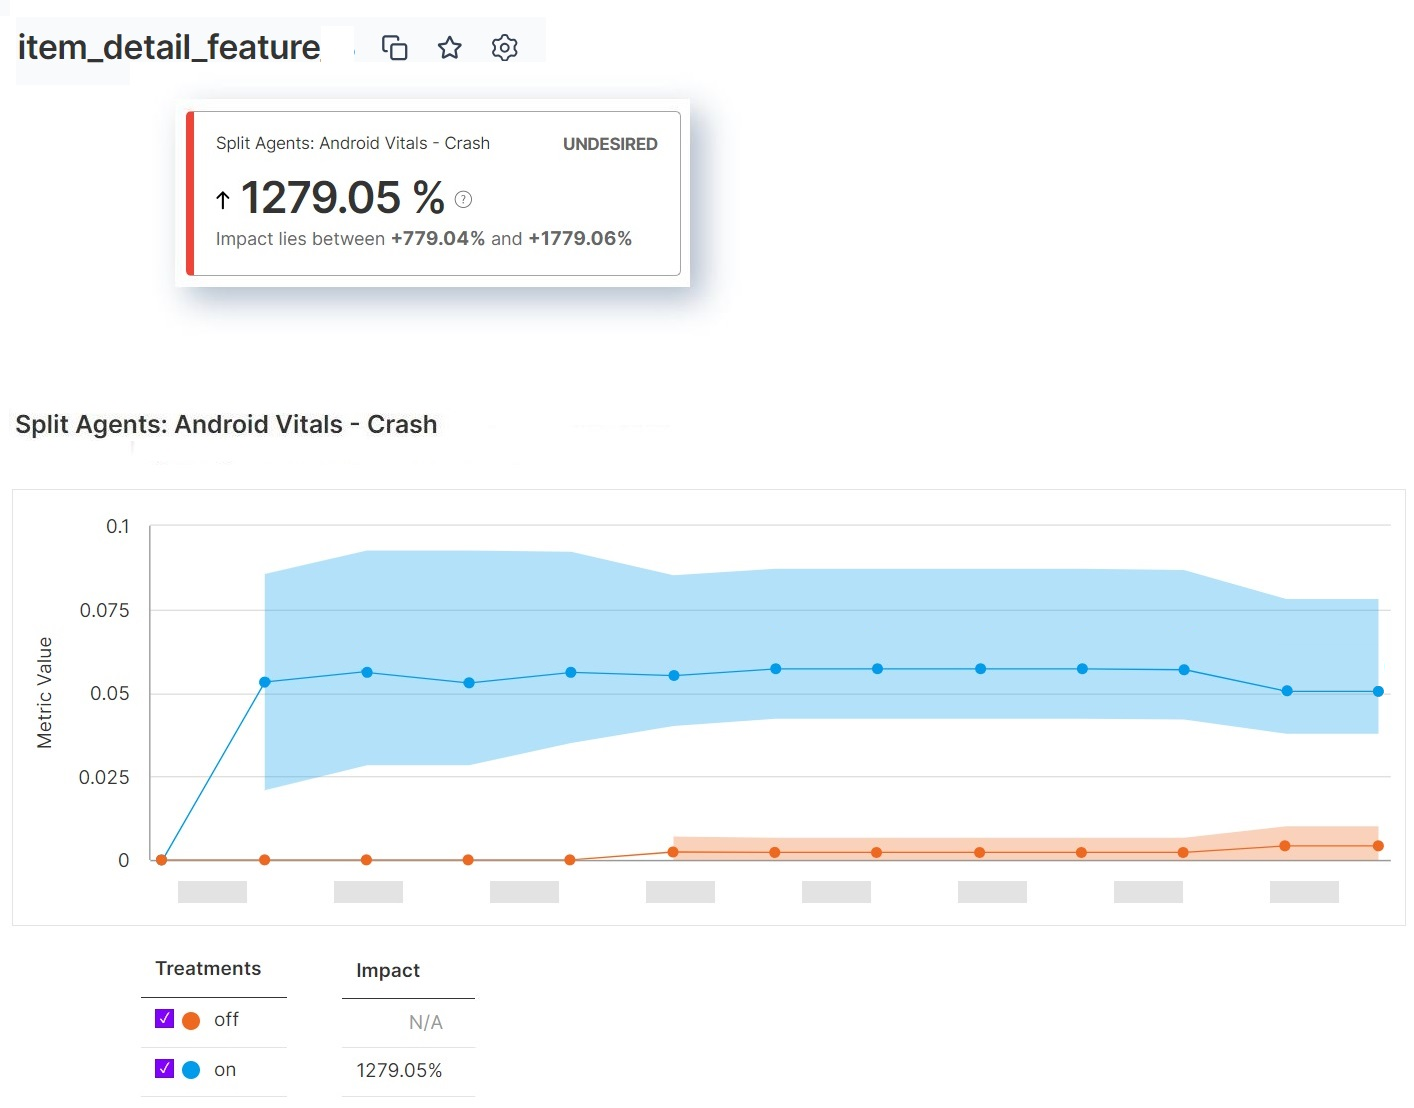
Split’s monitoring and alerting would be just as effective, even if you were rolling out multiple features simultaneously using different strategies, because Split cuts through the noise to analyze each feature’s data individually, making a feature’s individual impact crystal clear. Much like Spiderman’s spider sense. Even in complex scenarios IFID will dramatically reduce your mean time to discovery (MTTD) and convert your mean time to recovery (MTTR) to the time it takes to click a button.
Let’s now take a step back and pretend that you don’t yet know the defect in the new flagship feature (in our scenario), and let’s see how easily IFID would help you find it.
The Kotlin code example for this article is available here. It is built on the Android Performance Code Lab and, for demonstration purposes, simulates a degradation that causes an intermittent crash.
While this article demonstrates IFID for Android using the Split Android Suite SDK, IFID can be implemented with any of our SDKs. You will need a trial Split account or an existing account with the Measurement and Learning add-on.
1. Create an Active Flag
Implement a feature flag that receives traffic in a production environment.
Log in to your Split account or sign up for a free trial.
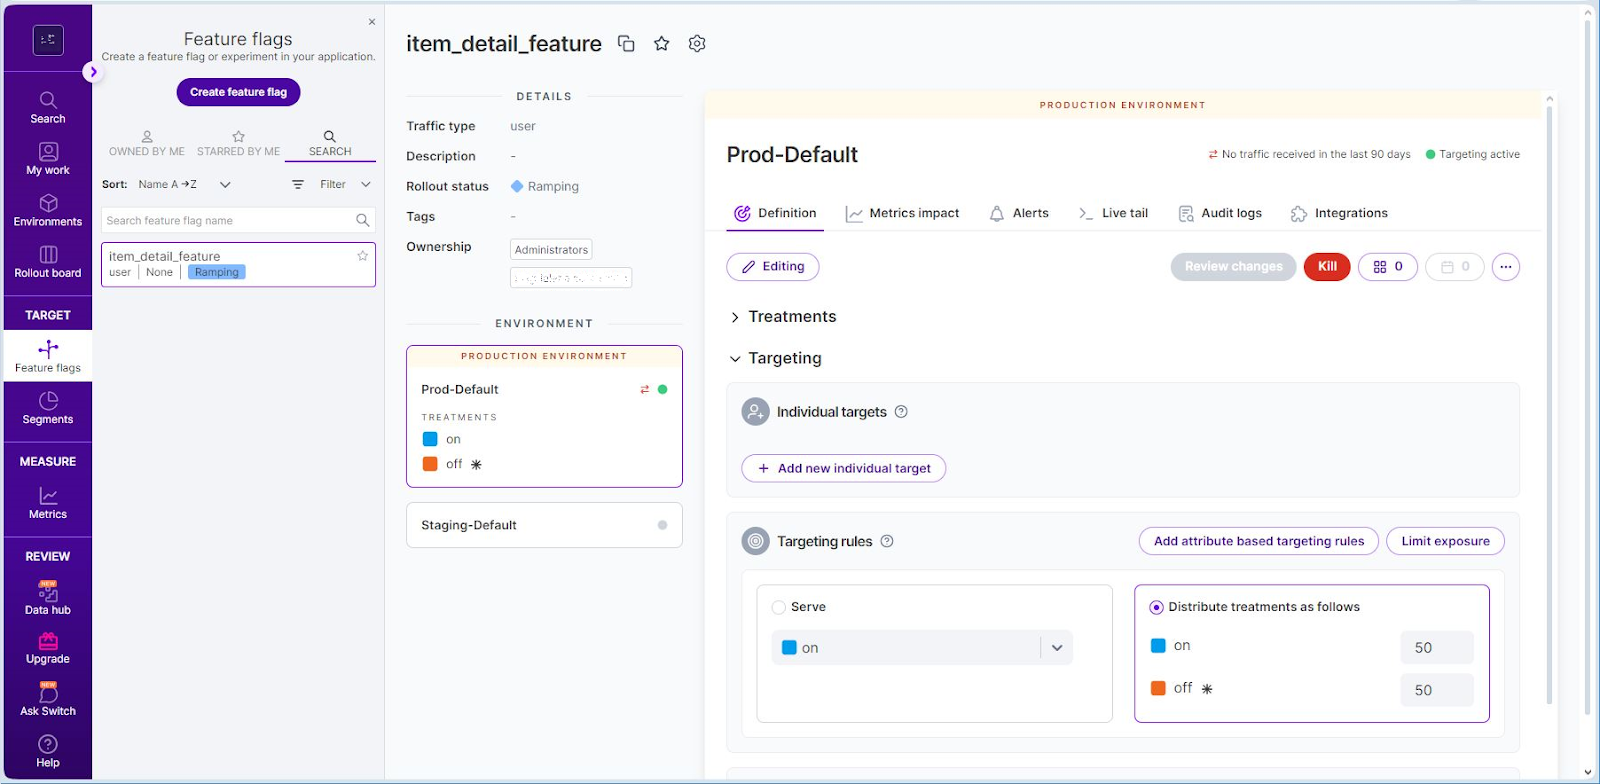
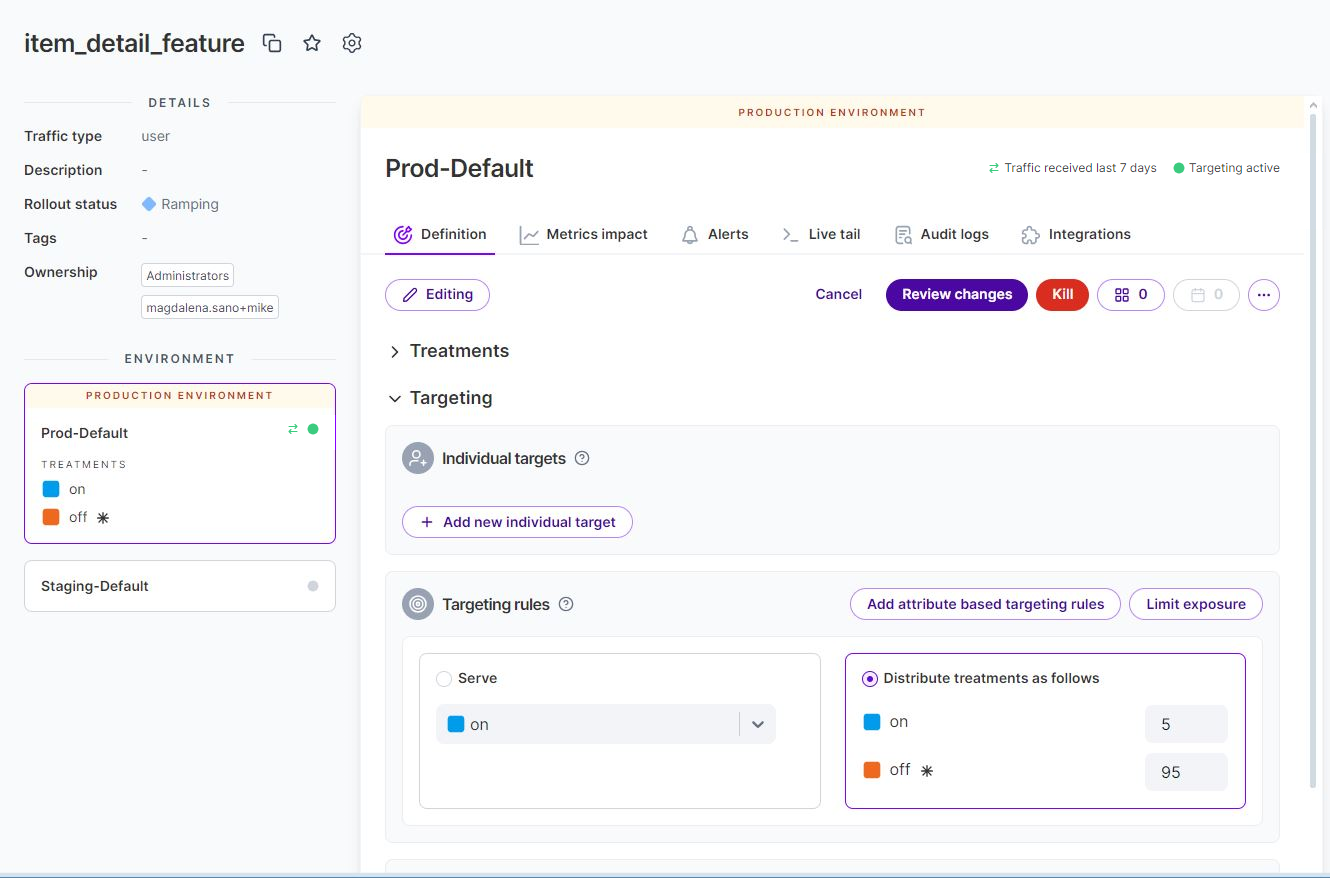
Click Feature flags in the left navigation pane and click Create feature flag. Name your feature flag item_details_feature, select the user traffic type (the default used by Split Suite), set yourself as the flag owner, and click Create.
Add targeting rules to make the feature flag active by clicking on a Production Environment on the details pane and clicking Initiate Environment. In the Targeting rules, select Distribute treatments as follows. Click the Review changes button at the top, and click Save to save the feature flag’s targeting rules. Your active feature flag will look like the following screenshot.
The feature flag is referenced in your code by its name, and Split’s statistical analysis engine will correlate events to the active flag treatment. We show you how to send event data in the next section.
Advanced tip: You can set up IFID for a feature flag that is active in a Pre-Production Environment by utilizing Metric alerting.
2. Send Event Data
Use Split Suite to send RUM event data.
In your code, import Split Android Suite and wrap a new feature with a Split feature flag evaluation, as shown below.
// Evaluate Split feature flag treatment (variation) for the user id
// that was passed to Split Suite upon initialization

when ( SplitSuiteWrapper.getSplitTreatment(FeatureFlag.ItemDetailFeature) )
{
   ItemDetailFeatureFlagValues.on.value -> {
      // The new development feature (item details feature) would go
      // in this block.

      // For demo purposes, we instead create an intermittent exception
      // (5% occurrence), to demonstrate Split's IFID (Instant Feature
      // Impact Detection) abilities.
      if ( 1 == (1..20).random() )
           throw RuntimeException("An intermittent exception was somehow triggered and correlates to the 'on' treatment.")
   }
   ItemDetailFeatureFlagValues.off.value ->  {
      // Execute the stuff that should be done if the feature flag is
      // off (e.g. the old way of doing something)
   }
   ...
}
Split Suite will automatically send the crash Android core vitals event to Split. We create a metric to measure this event in the next step.
Advanced tip: Other ways to send event data include using the track() method of one of the Split SDKs or RUM agents, using the Split API, or using a third party integration. In addition to Android vitals, you can send custom events. Browser Split Suite is also available for web event tracking.
3. Create Metrics
Create a metric in the Split UI to measure events.
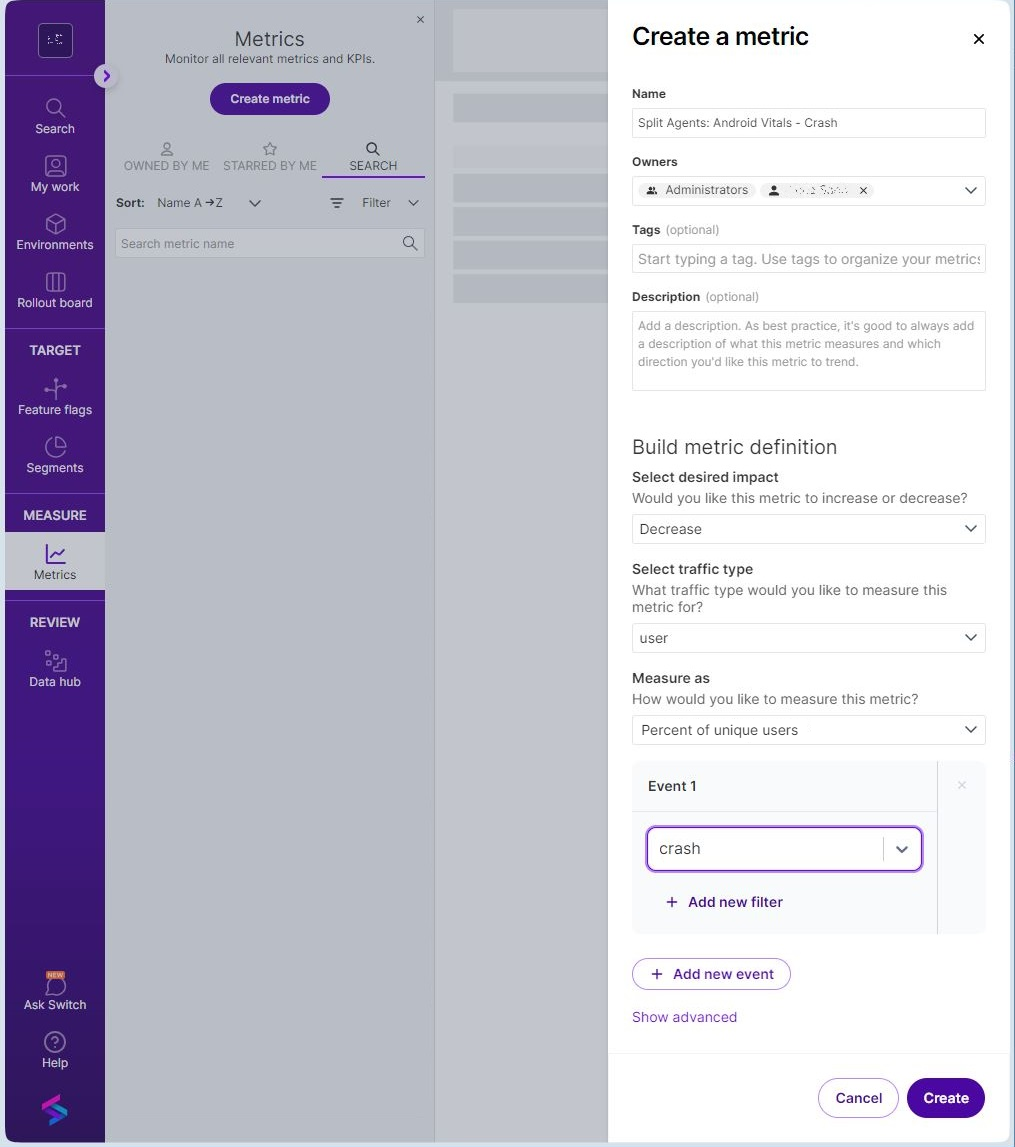
To create a Split metric that will measure our Android crash event, click Metrics | Create metric. In the Build metric definition section, select Decrease for the desired impact, the user traffic type, the Percent of unique users measurement, and the crash event. Click Create to save the metric.
This metric will measure the crash event. To activate alerting for this metric we will need a percentage rollout.
Advanced tip: Split will soon be automatically creating out-of-the-box Metrics for measuring some Android core vitals.
4. Use a Percentage Rollout
Set-up a percentage rollout for the feature in Split UI.
For demonstration purposes, we adjust our item_detail_feature flag to a 5% percentage rollout for the on treatment (in our code, the feature flag evaluation will return on for 5% of users). At this rollout percentage, for an app released in production to 10,000 users, 500 would see the new feature.
The moment we save the feature flag with percentage rollout targeting rules, Split will start monitoring the flag’s impact on metrics.
We set up key metrics as our last step, to better observe and understand the feature’s impact.
Advanced tip: Feature flag percentage rollouts can be refined by limiting feature flag exposure and by applying filtering (if-else conditions based on user groups/lists or other feature flag evaluations).
5. Understand Impact
Set a key metric for automated feature flag significance alerting.
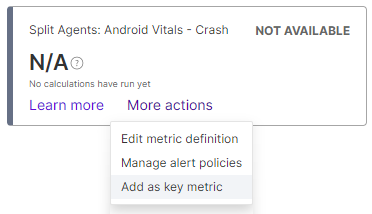
Click on the feature flag’s Metrics impact tab, and set the Split Agents: Android Vitals - Crash metric as a key metric for the feature flag, as shown below.
This activates significance alerting for the feature flag. Split will begin firing alerts for key metrics that show impact. Once the flag’s Fixed horizon experimentation conditions are satisfied or the Sequential testing minimal sample sizes are fulfilled, the metric impact results are displayed on the metric cards.
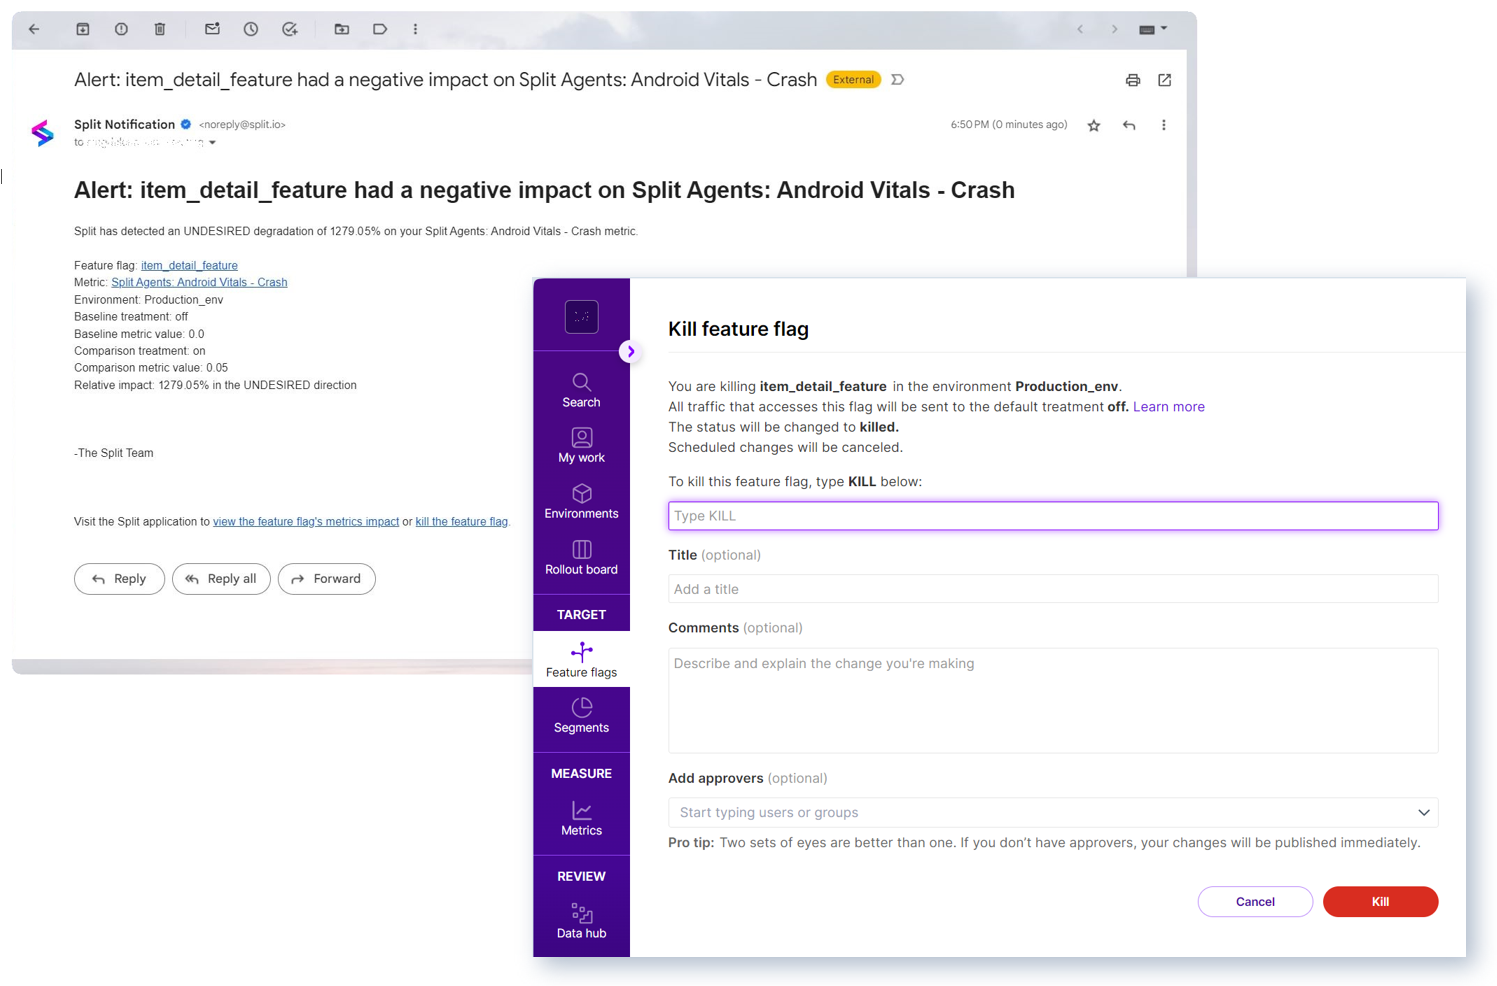
You will see the alert the moment the crash event degradation is calculated for the on feature flag treatment (compared to when it is off). When you receive a degradation alert, you will have the option to rollback the feature instantly (by clicking the feature flag’s Kill button) – tech that even Batman would envy.
On the other hand, when you see a positive impact, you can choose to roll out your beneficial feature more quickly, saving your team valuable time while increasing your Google Play rating and customer satisfaction.
Advanced tip: Feature flag alerting will also alert you of a 5% (or greater) impact in the metric’s desired direction, signaling safety in your feature rollout. In addition to feature flag alerting, highly customizable, fine-grained alerting of percentage and absolute metric degradations can be set by defining Metric alert policies.
IFID Is Your Superpower
Instant Feature Impact Detection is our superpower. Turn on our IFID capabilities and experience the difference between seeing a small inconclusive upward tick shown on an Application Performance Monitoring (APM) dashboard (difficult to correlate and almost indiscernible) and receiving a real-time feature-specific Split impact alert, that accurately pinpoints causality and instantly equips you with the correct resolution.
With 5 easy steps, switch on IFID, and let it be your superpower.
You can find the complete code example in GitHub, with thanks to Gaston Thea for a super code review. Thanks to Justin Horrigan for powerfully perceptive blog content feedback.
Switch It On With Split
The Split Feature Data Platform™ gives you the confidence to move fast without breaking things. Set up feature flags and safely deploy to production, controlling who sees which features and when. Connect every flag to contextual data, so you can know if your features are making things better or worse and act without hesitation. Effortlessly conduct feature experiments like A/B tests without slowing down. Whether you’re looking to increase your releases, to decrease your MTTR, or to ignite your dev team without burning them out–Split is both a feature management platform and partnership to revolutionize the way the work gets done. Schedule a demo to learn more.
Get Split Certified
Split Arcade includes product explainer videos, clickable product tutorials, manipulatable code examples, and interactive challenges.