
When Split is developing new features, enabling our customers to be more data driven is always top of mind. We believe in the power of metrics and Split’s existing metrics impact page allows you to make powerful product and engineering decisions and understand the effect on your business goals.
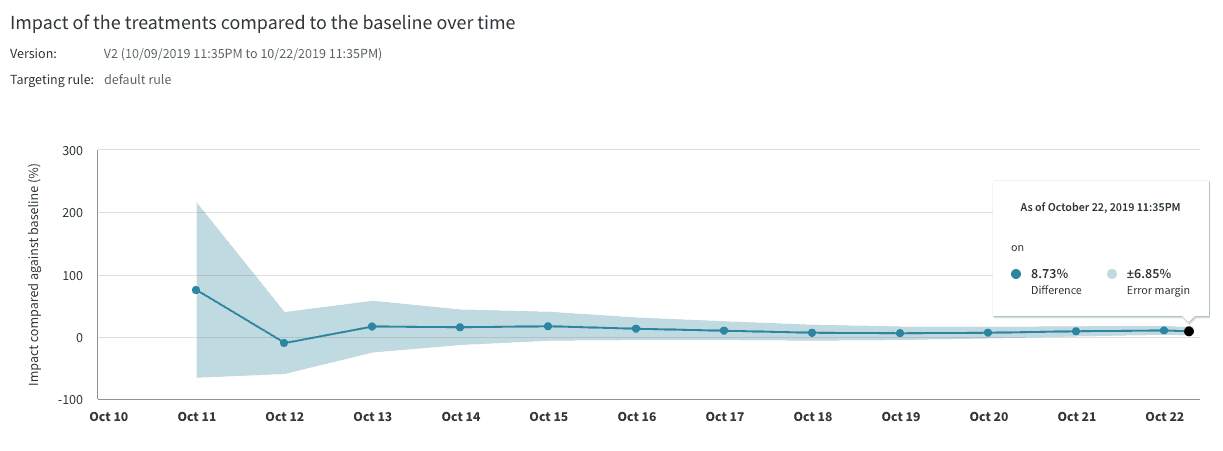
Split’s metric details and trends view provides additional insight to understand the why behind your metric’s impact. This view also helps you diagnose any problems with your experiment. For example, in the chart below the trend clarifies that the error margin has decreased over time and that the impact is positive over the baseline, both great indicators for an experiment.
We have two exciting new updates for the metric trends view: we now show metric values over time and we now show multiple treatments compared on the same graph.
Impact versus value
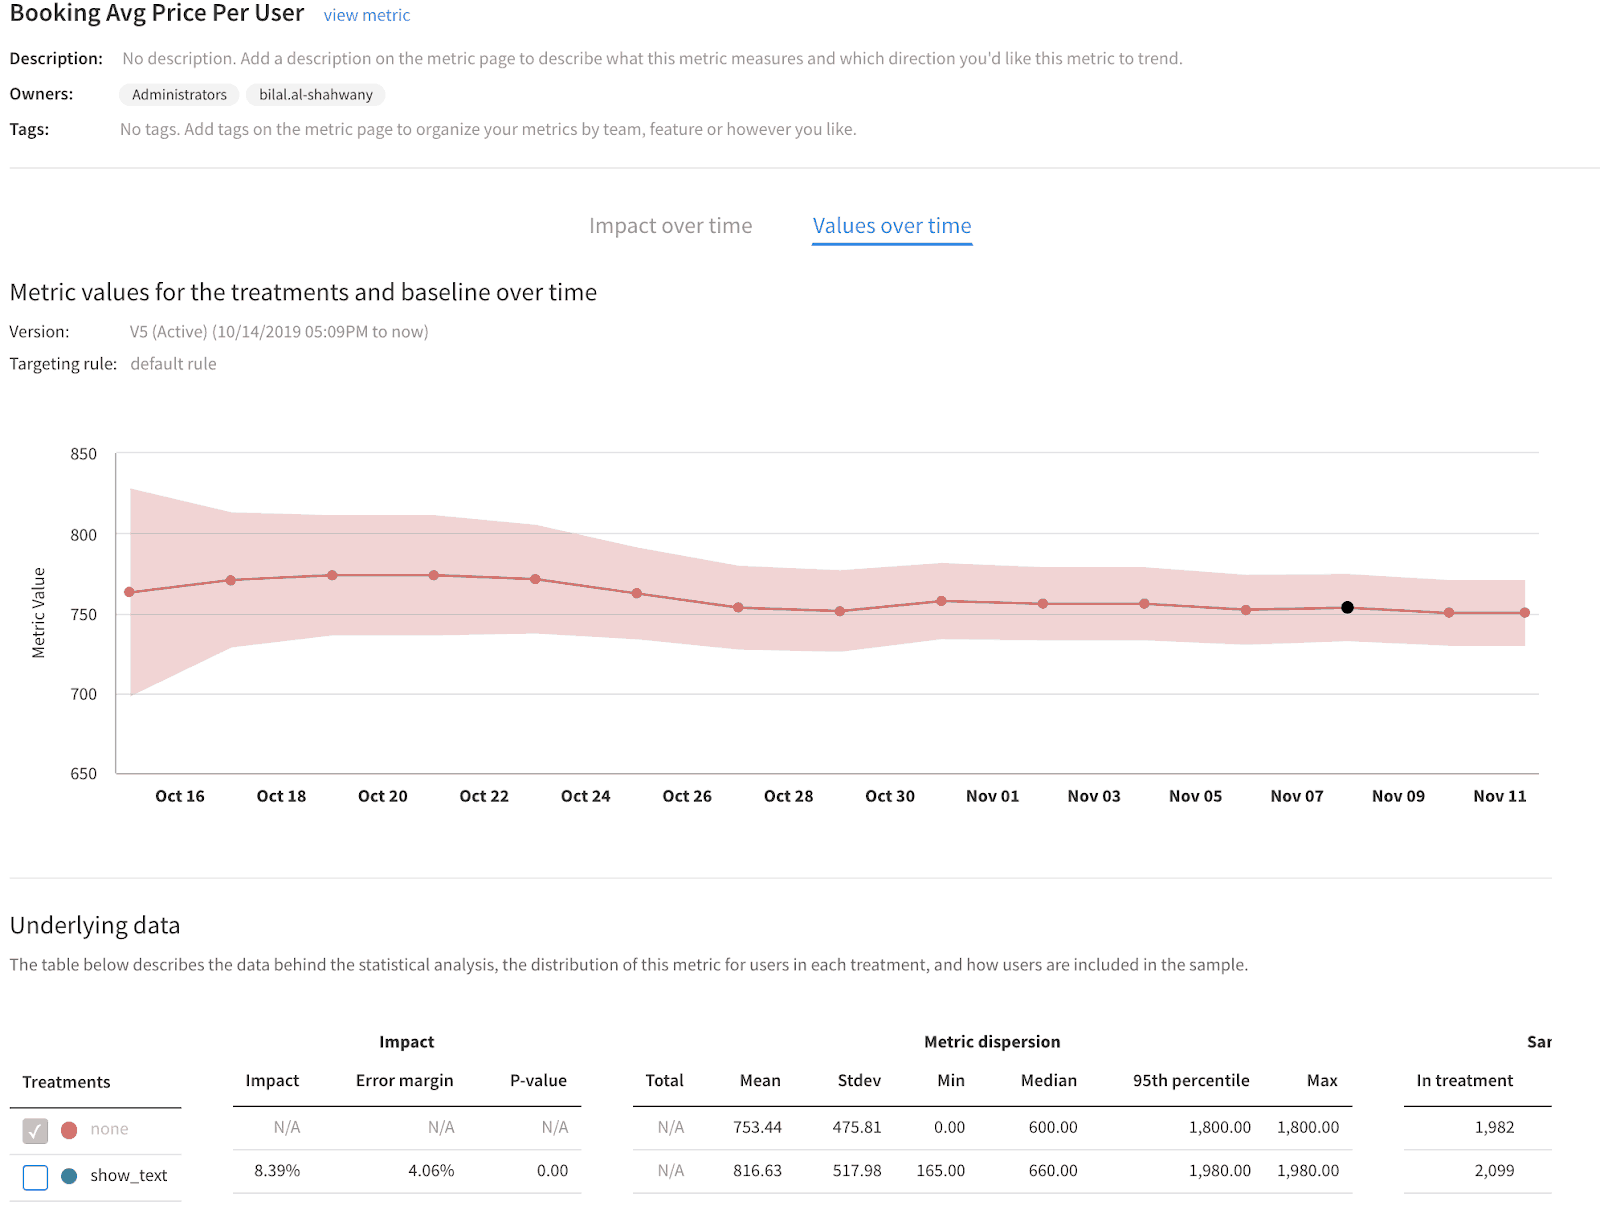
In addition to the metric impact over time, you can now also view the metric value for each treatment in your split over time. The line chart in the ‘impact over time’ tab allows you to easily visualize the difference in the impact as well as how the error margin has changed throughout the version of a split. The line chart represents the cumulative impact and is based on all the data we have received up until the last calculation update. The ‘values over time’ tab will allow you to debug or spot check any extreme fluctuations in your metrics over the course of the split version.
We recommend reporting on the metric impact and it’s error margin at each review period day, which are typically on the 7th or 14th day of a split version and use the metric value trend line as secondary information.
Interpreting metric values over time
When viewing experiment results as a relative percentage impact it can be difficult to understand what that percentage impact equates to. Showing the metric value in absolute terms over time provides this context and makes the percentage impact more meaningful. Whether you are digging into your key or your guardrail metrics, your product metric or your engineering metric, you can visualize its true performance.
The metric value in the line chart corresponds to the mean value of the metric which shown in the table below the chart. The table also provides additional information of the metric dispersion such as its standard deviation, minimum value, maximum value, and its 95th percentile.
Interpreting multiple treatments over time
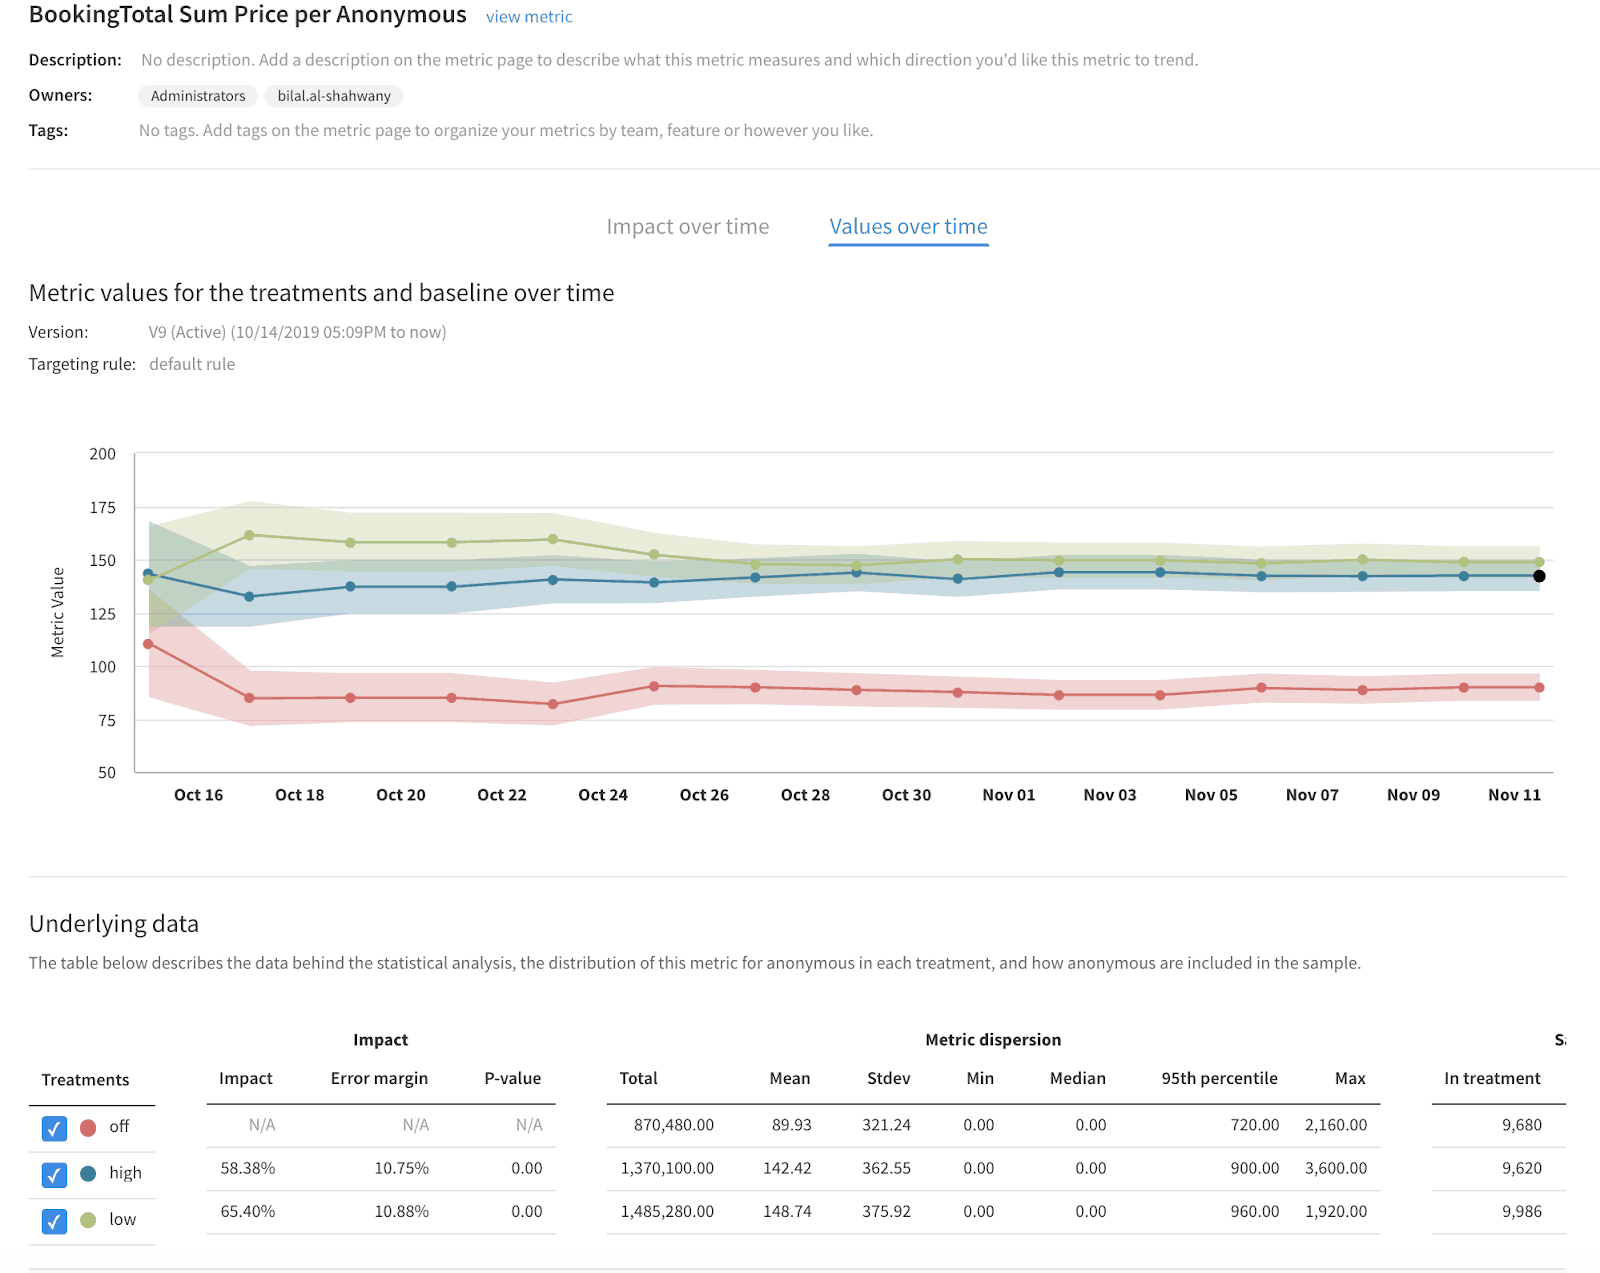
The majority of our customers test at least two treatments within a split, some customers testing more than two, as it is now even easier with our dynamic configuration functionality. Therefore with this release you are able to see multiple treatments results against your baseline treatment in one view, allowing you to gain a more holistic understanding of their experiment. This will help our users better interpret their experiment results and help them decide on the next steps of their rollout plan and testing cycle.
Ready to get started with your own experiments? Try out a free 14-day trial or check out the comprehensive O’Reilly eBook on Understanding Experimentation Platforms.
Get Split Certified
Split Arcade includes product explainer videos, clickable product tutorials, manipulatable code examples, and interactive challenges.
Switch It On With Split
The Split Feature Data Platform™ gives you the confidence to move fast without breaking things. Set up feature flags and safely deploy to production, controlling who sees which features and when. Connect every flag to contextual data, so you can know if your features are making things better or worse and act without hesitation. Effortlessly conduct feature experiments like A/B tests without slowing down. Whether you’re looking to increase your releases, to decrease your MTTR, or to ignite your dev team without burning them out–Split is both a feature management platform and partnership to revolutionize the way the work gets done. Switch on a free account today, schedule a demo, or contact us for further questions.