
In this post, we will talk about key experimentation concepts including how to choose your Overall Evaluation Criteria (OEC) for your experiments and how to increase the sensitivity of those metrics through metric filtering and metric capping.
What Makes a Valuable OEC?
OEC is the most important metrics of your experiment and is a measure of long-term business value or user satisfaction. If we take Uber as an example, we can assume that the “rides per user” metric will be incorporated into their OEC as it is a strong indicator that a user has found value in the Uber app. Comparing this to other metrics like “distance per ride” or “sessions per user,” while still important to measure, they are not a true indicator of value. There are three essential characteristics of an effective OEC to consider to help you decide which metrics:
Sensitivity
The experiment metrics you chose should change due to small changes in user satisfaction or business value so that the result of an experiment is clear within a reasonable time period. For example, if a user only buys something from your website once a year, this will not be a useful metric for an experiment as it will be difficult to influence. You may be creating a more positive user experience, but it won’t be noticeable if you are using only this one metric.
Directionality
If overall the business value increases, the metric should move consistently in one direction. If it decreases, the metric should move in the opposite direction. Some metrics can have ambiguous directions. For example, you may be measuring engagement with your customer support. Perhaps an increase in this metric might be a good thing as it could indicate more engagement with your core product. However, a decrease in this metric could indicate your core product has become easier to use and less support required.
Understandability
To follow on from the point above, ensure the metric you are measuring is understandable, both in its direction and definition. Ensure that your chosen OEC ties and experiment directly to business value. It should be easily understood by your entire organization, from your summer interns all the way to your management team.
What Additional Metric Types do I Need to Consider?
Feature level metrics
These metrics are specific to an individual experiment and could be things such as click-through rate, scroll rate, and certain inputs. They are metrics that are important to a particular team.
Guardrail metrics
These metrics are the metrics that should not degrade in pursuit of the OEC, and the team should take action if they do so. Similar to the OEC, they should be directional and sensitive and still tie to business value but indirectly. For example, page load times, app crashes, unsubscribe rates.
Creating Metrics in Split
Available for on Split’s free Developer Account as part of the Experiment package.
It is now even easier to create metrics in Split that are tailored to the needs of your organization. You can define the function to perform or calculate specific analyses on events. Split supports five different functions to provide the foundation of your metrics; sum, count, average, ratio, and percent. These functions can be performed across your traffic type or per your traffic type. Across metrics represent a total value and will not be marked statistically significant. We recommend using “across” to measure the total change and to use “per” to measure the total change per your traffic type.
Advanced Metric Settings
What is Metric Filtering and Why is it Useful?
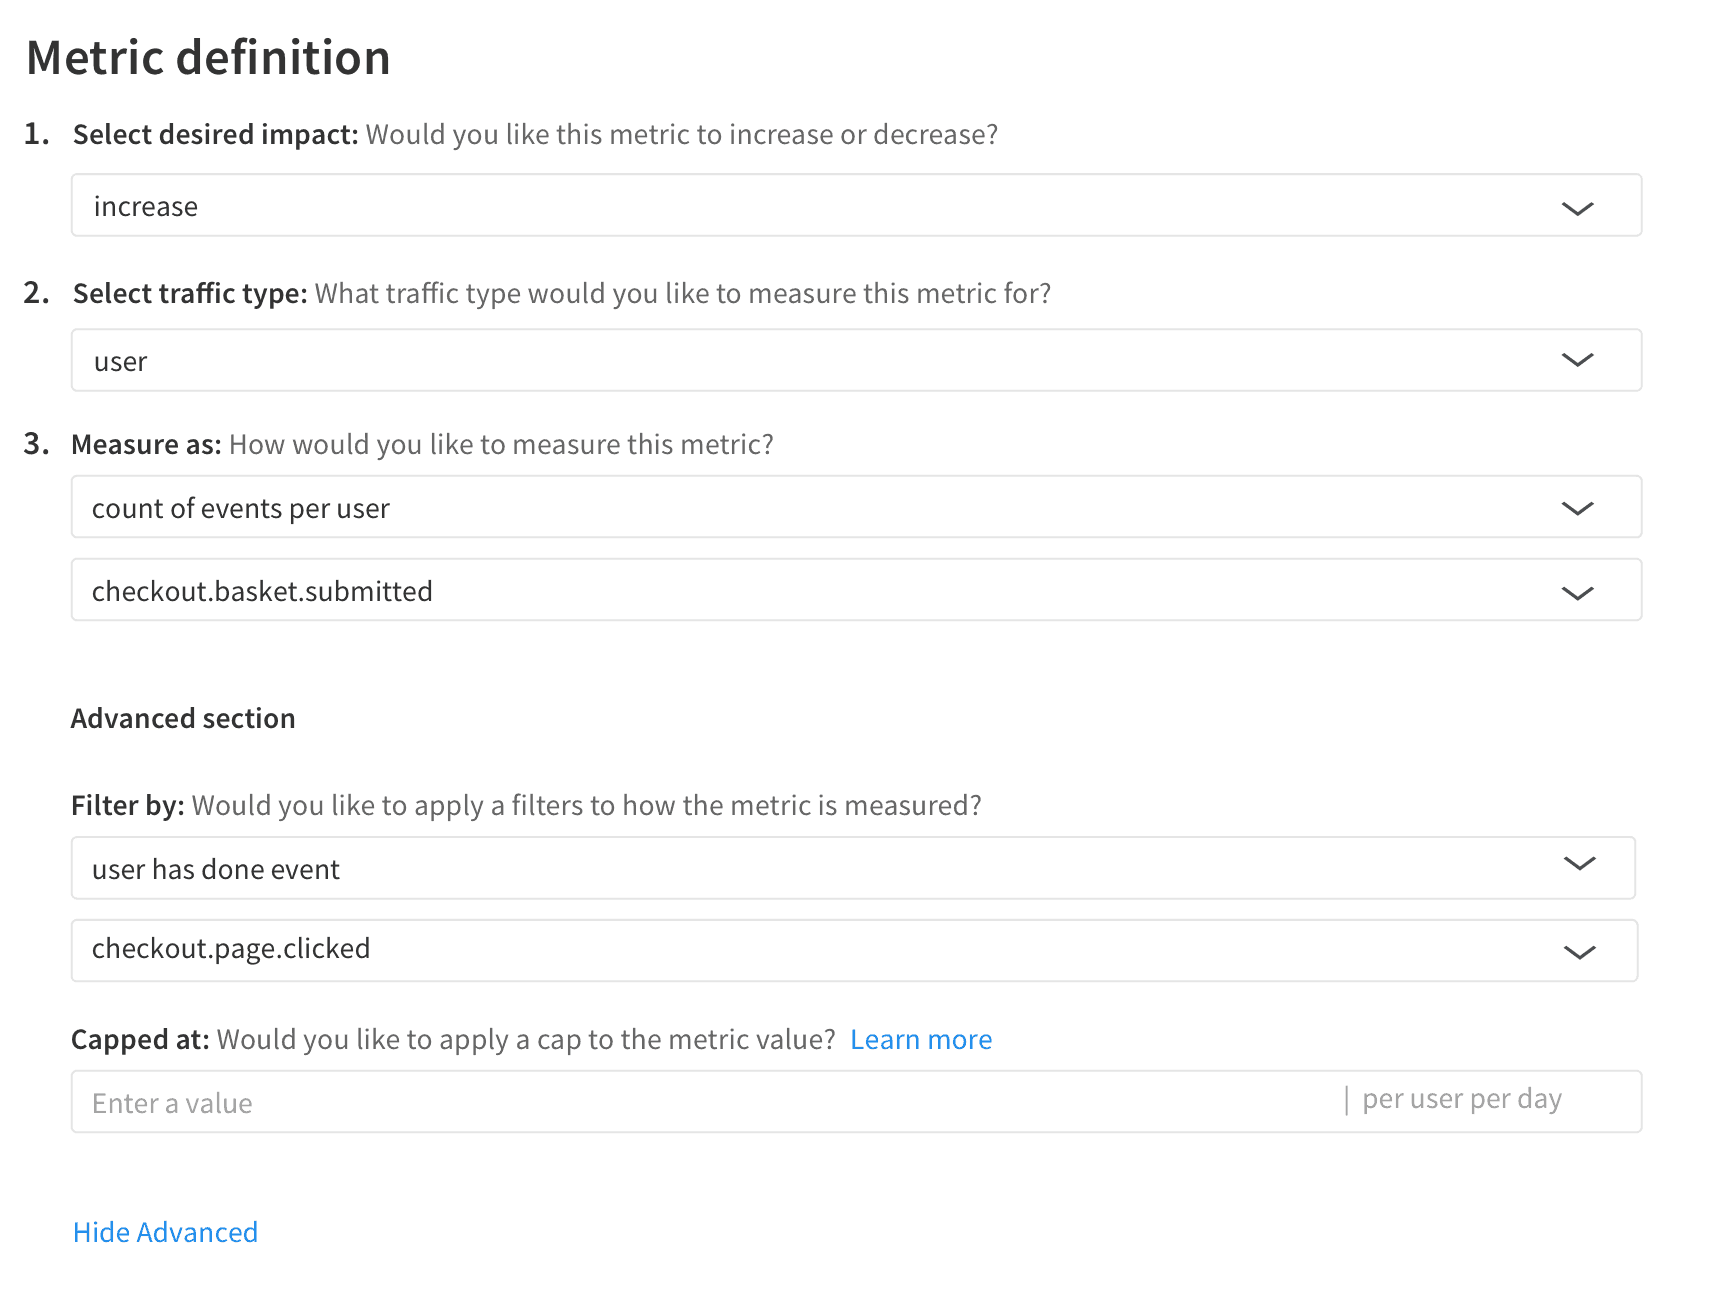
Applying a filter to your metric can help you improve the sensitivity of your metric by refining the sample used in the analysis. Filtering is most often used to provide deeper analysis of how customers progress through a particular flow in your product. An e-commerce company may seek to drive an increase in purchases, and it is important to track that purchase rate globally, but it is often valuable to see where in the process customers are dropping off. By filtering, you can see the behavior of customers who reach particular points in the funnel, such as purchases of those who visited a product page, or those who added something to their cart. Filtering is also used to create metrics that target only users who engage in a particular behavior, for instance observing the support ticket rate of those users who experience an exception or of users who completed the onboarding process.
Here’s how this example looks in Split:
What is Metric Capping and Why is it Useful?
Applying a cap to your metric definition can have a dramatic impact on your experiment results. With metric capping, any outlier values in your metrics will be capped and replaced with a fixed threshold value. By applying this cap, you can reduce the variance in your metrics, reducing the impact of outliers, and drive toward significance faster.
For example, perhaps you have an experiment with a goal to drive an increase in checkout value on your website. Looking at your historical data, you know in the last 6 months your checkout value has been an average of $60 per user per day. Therefore, if you were to apply a metric cap, based on the context of your organization, any checkout value above $300 could be considered an outlier. In this example, the metric cap would be set at $300 per user per day.
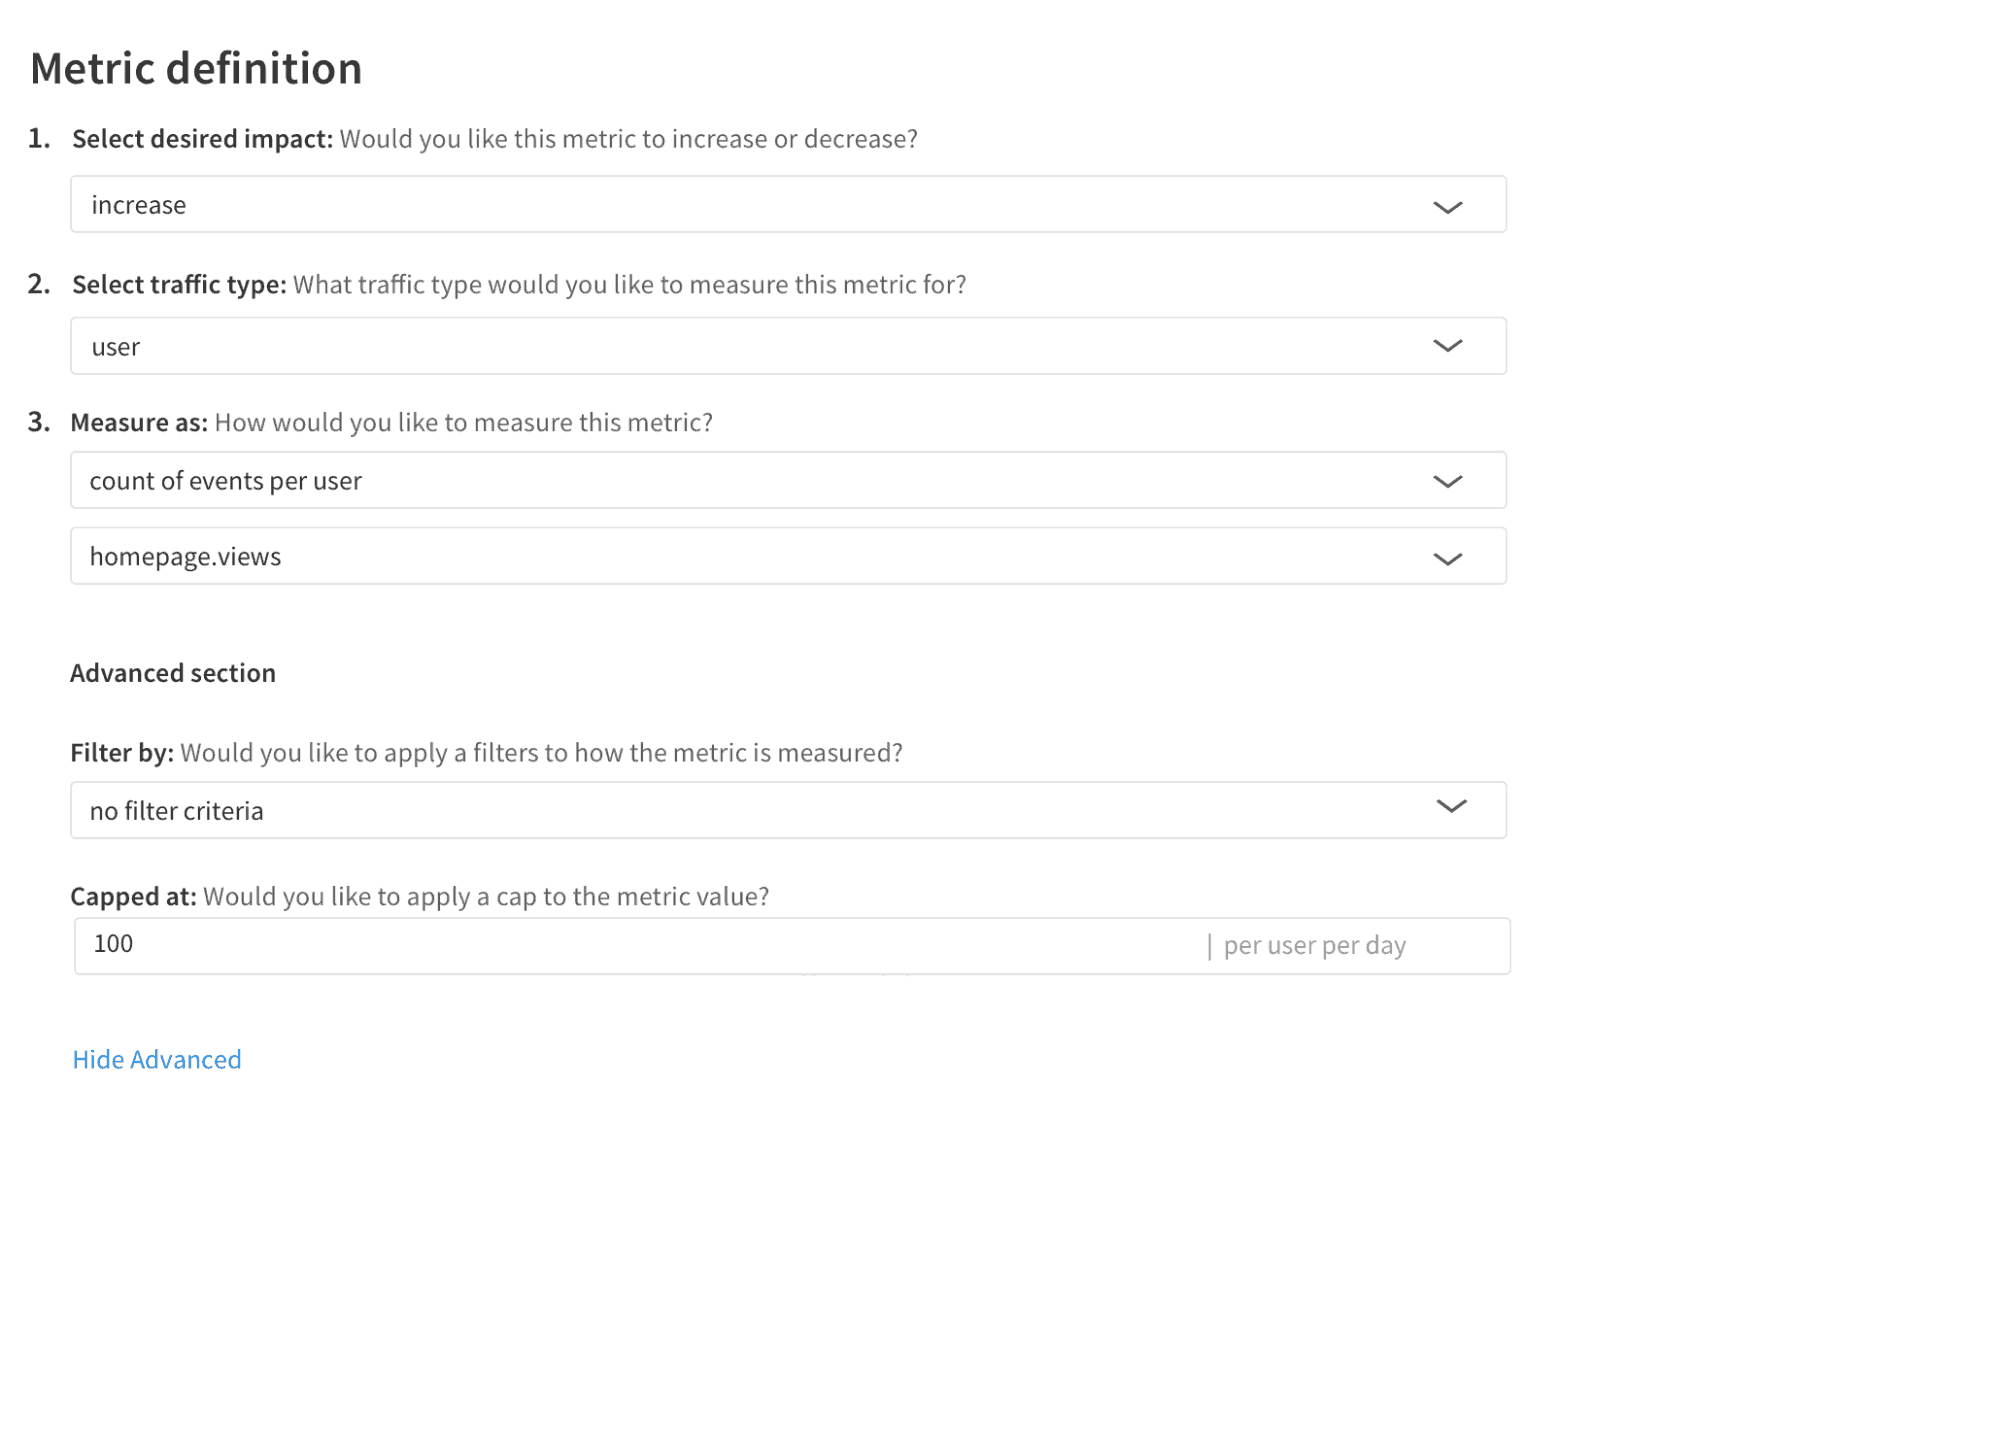
In addition, metric capping can also remove the risk of bot activity included in your experiment analysis. This is particularly useful for metrics such as views per user. For example, say based on historical data of your website the average number of homepage views is 40 views per user per day. Therefore if you were observing 1000s of views per user per day, you could confidently categorize this as bot activity.
Here’s how this metric capping example would look like in Split:
When you are starting off in experimentation give yourself the flexibility to iterate on what you choose to measure. As you hone in on what makes sense for your organization you will discover what truly reflects business value. We hope this post gives you some useful frameworks to help you define the metrics for the experiments ran by your organization.
Get Split Certified
Split Arcade includes product explainer videos, clickable product tutorials, manipulatable code examples, and interactive challenges.
Switch It On With Split
The Split Feature Data Platform™ gives you the confidence to move fast without breaking things. Set up feature flags and safely deploy to production, controlling who sees which features and when. Connect every flag to contextual data, so you can know if your features are making things better or worse and act without hesitation. Effortlessly conduct feature experiments like A/B tests without slowing down. Whether you’re looking to increase your releases, to decrease your MTTR, or to ignite your dev team without burning them out–Split is both a feature management platform and partnership to revolutionize the way the work gets done. Switch on a free account today, schedule a demo, or contact us for further questions.