
Split’s Feature Monitoring capabilities automatically detect issues in releases, determine the feature at fault, alert the right team, and allow you to switch off faulty features instantly.
On the face of it, this might sound similar to common Application Performance Management tools (APMs), such as Datadog, AppDynamics, or New Relic. These software analytics tools help you visualize, monitor, and track your application’s performance and receive notifications when things begin to look abnormal or concerning.
However, by combining existing feature flag concepts with rigorous scientific analyses, Split’s Feature Monitoring offers a number of invaluable benefits over these traditional tools. The additional granularity and statistical rigor enables you to detect issues faster, more confidently, and immediately identify the specific feature which is negatively impacting your users.
Let’s look at how and why Feature Monitoring brings you these advantages.
Know what is causing degradations in your metrics
By utilizing feature flags, Split can match performance data to the specific features a user is exposed to. Rather than merely monitoring overall performance, we run our statistical analyses on a feature-by-feature basis; when something goes wrong, engineers will know right away which portions of their release are performing poorly.
This allows you to reduce the time to restore service. By taking the guessing out of root cause analysis, Feature Monitoring will make your average time to resolution as short as the time it takes you to press the kill switch.
We are able to do this because Split’s statistical engine conducts scientifically rigorous statistical analyses that measure causation. We go beyond simply measuring whether your metrics have moved up or down; these movements happen naturally every day simply due to changes in traffic, seasonality and a variety of other factors.
Instead, Split tests whether your release directly caused your metrics to move. If the number of visitors to your site is half of what it usually is because of a public holiday for example, Split’s statistical engine is smart enough to know that this isn’t due to your code.
Detect smaller degradations quicker
Another significant benefit of conducting our statistical analyses on a feature-by-feature basis is that issues affecting only subsets of users are significantly more visible.
Traditional performance monitoring tools aggregate together all data from across the whole of your product and user base. This means that undesired effects on subsets of users can get washed-out by the rest of the unaffected user base.
For example, imagine a release which updates a feature on one particular page of your site, let’s say it’s a change to the algorithm which orders search results. With Feature Monitoring, by putting this change behind a feature flag at the relevant point in the codebase, Split will look only at data from users who interact with that particular area of your product. This can drastically increase the visibility of an issue that might arise.
To continue with this example, say 10% of the visitors come to your site to conduct a search and you run an initial 50%:50% rollout of the new search algorithm. This means 50% of the searches will be powered by the new algorithm and 50% (the ‘control’ population) will see the existing algorithm.
When looking at data aggregated across your whole product, as with a traditional APM, only 5% of users in that aggregated data set will have seen the new search algorithm (50% of 10%). Even if all those users were to see an error message, that’s at most 5% more users seeing an error which can easily be missed by traditional monitoring tools.
In contrast, since Split looks on a feature-by-feature basis at only the relevant users and compares this to a control population rather than historical data, you can directly see the full impact. If the new algorithm increases the error rate of exposed users by 40%, Split will measure and surface that exact number. With the above example, tools which use aggregated data for the entire population however would see only a 2% increase in the error rate!
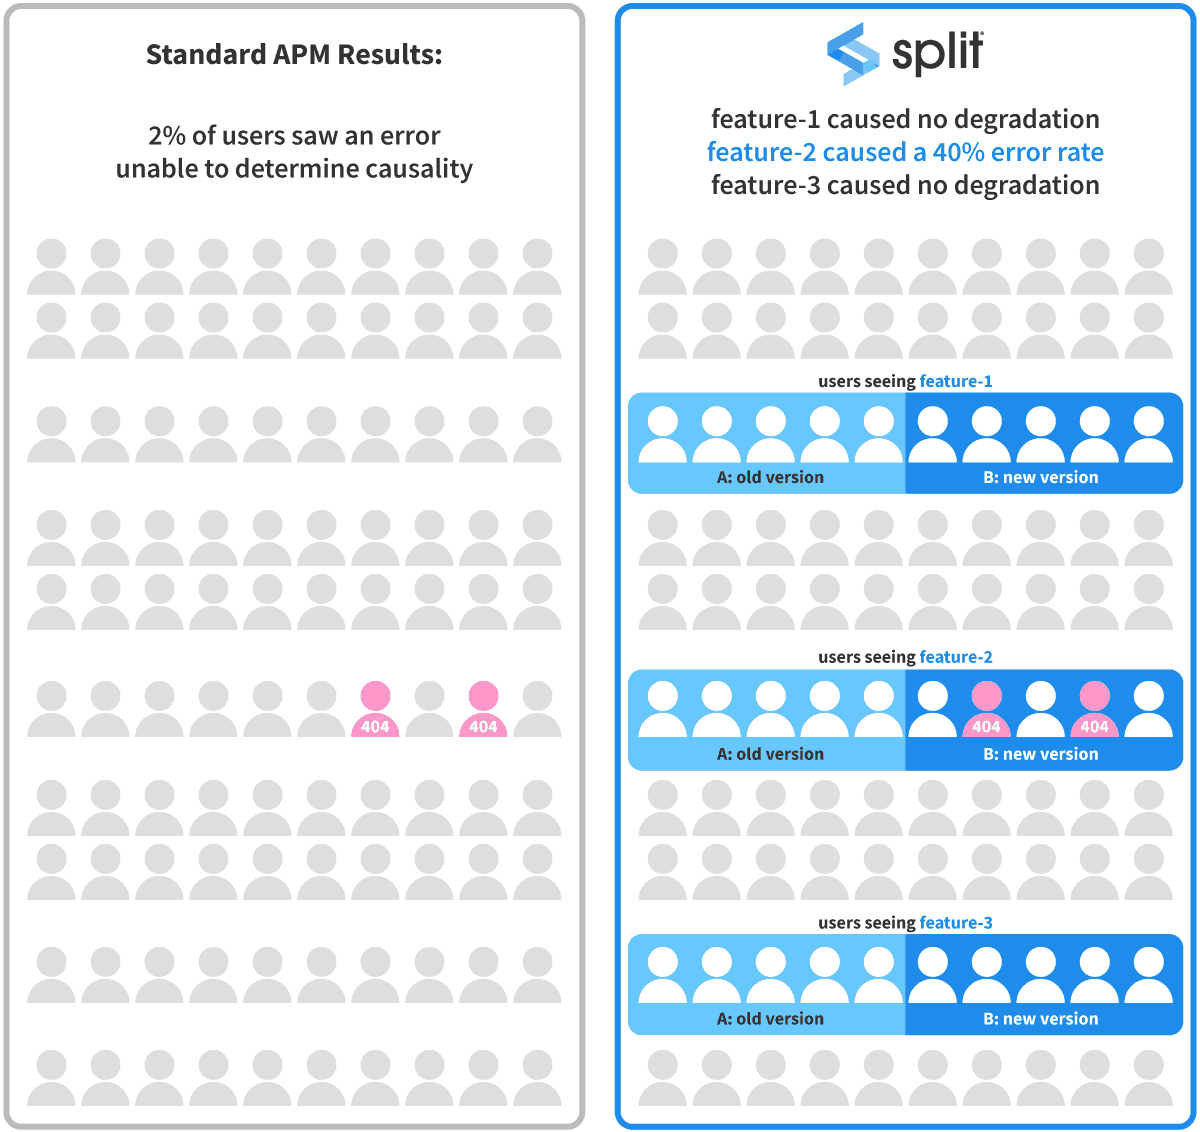
Figure 1 — A visualization of the example in the text above. If your code change only affects a subset of users, it can be difficult to see in the aggregated data. By matching performance data to the specific features users are exposed to Split can directly measure the true, causal impact on the relevant subset.
More control over your rate of false alerts
A common complaint from engineering teams using standard performance monitoring tools is the high level of false alerts. It can be very difficult to calibrate alerting thresholds and settings to the right levels, ensuring alerts are only raised when there is an urgent issue without running the risk of missing important incidents.
This can lead to alert fatigue — if alerts are too frequent, and too often turn out to be false alarms, then engineers can get dangerously accustomed to alerts and stop giving them their full attention. This increases the risk of missing the warning signs when a real incident occurs.
Split’s Feature Monitoring is based around the scientific techniques of statistical inference. This allows us to limit and control your chances of receiving false alerts. By default, we ensure your chances of a metric firing an alert when your change did not cause a degradation is, at most, 5%. If this doesn’t suit your needs then adjusting this is as simple as changing a parameter in your statistical settings.
Another benefit of using these more robust statistical techniques is that you can easily understand the scale of degradations that our platform can inform you of. Any tool or technique will have its limitations, so you can’t expect to be accurately alerted for the very tiniest of changes to metrics. By using robust statistical techniques you can have a full understanding of, and control over, the delicate balance between getting too many false alarms and missing real incidents.
Automatically adapts the alert threshold
A pivotal part of performance monitoring alerts is configuring the settings — for traditional APMs this is likely to include things like choosing the time frame with which results should be aggregated over and choosing the threshold which, when crossed, causes an alert to fire.
This can be a difficult and frustrating task. The typical level of your metrics will usually change over time as your business develops, needing alerts to be reconfigured. Average values, and the scale of typical variations, are also likely to vary for different areas of your product. For some metrics this may lead to a few outliers skewing the results despite the large majority of users seeing no degradation. This can make it difficult, or impossible, to configure alerts that are well suited to detect changes across all areas of your site.
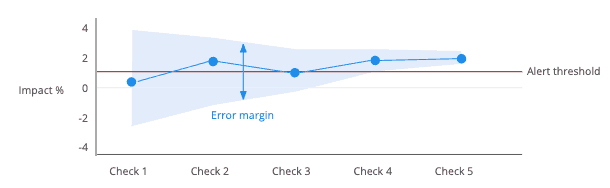
Split removes this concern by automatically measuring and updating our knowledge of the ‘normal’ values, and expected variation in those values, for each individual release. We always compare to a statistically identical control population.
Hence, with Feature Monitoring, the configuration of alerts is both simplified and able to automatically adapt. We allow you to set a degradation threshold as either a relative percentage change or an absolute change and, importantly, the baseline against which this is compared is always representative of the subset of users, or interactions, which are relevant to the specific feature you’re testing. Check out more about feature monitoring in this webinar and video demo.
Get Split Certified
Split Arcade includes product explainer videos, clickable product tutorials, manipulatable code examples, and interactive challenges.
Switch It On With Split
The Split Feature Data Platform™ gives you the confidence to move fast without breaking things. Set up feature flags and safely deploy to production, controlling who sees which features and when. Connect every flag to contextual data, so you can know if your features are making things better or worse and act without hesitation. Effortlessly conduct feature experiments like A/B tests without slowing down. Whether you’re looking to increase your releases, to decrease your MTTR, or to ignite your dev team without burning them out–Split is both a feature management platform and partnership to revolutionize the way the work gets done. Switch on a free account today, schedule a demo, or contact us for further questions.