
Product teams today are not only tasked with delivering new features but also delighting their customers with the right features. Whether crafting a vision for the product roadmap or experimenting with how a new feature should work, feature flags and data are crucial to success. At Split and Amplitude, we couldn’t agree on this more. Our new data integration allows product teams to bridge the gap between feature delivery and user behavior for more in-depth product intelligence and actionable insights.
What is Amplitude?
Amplitude is the leading product intelligence platform that allows you to use your customer data to answer why certain behaviors and outcomes occur and make data-driven decisions on how to improve your product. In helping companies arrive at these decisions, Amplitude tracks one trillion events per month of product usages such as page views, clicks, and conversions.
However, if your team is also using feature flags, product usage data only tells half the story. The other half lies in Split’s impression data, which is generated each time a user is exposed to a variation of a feature flag. The impression is essentially a record of who saw what in your product, which is critical in understanding the actions they subsequently took. Given that Split delivers 1 trillion feature flags a month, there’s a lot of impression data to leverage.
Use Feature Data to Setup and Analyze Cohorts in Amplitude
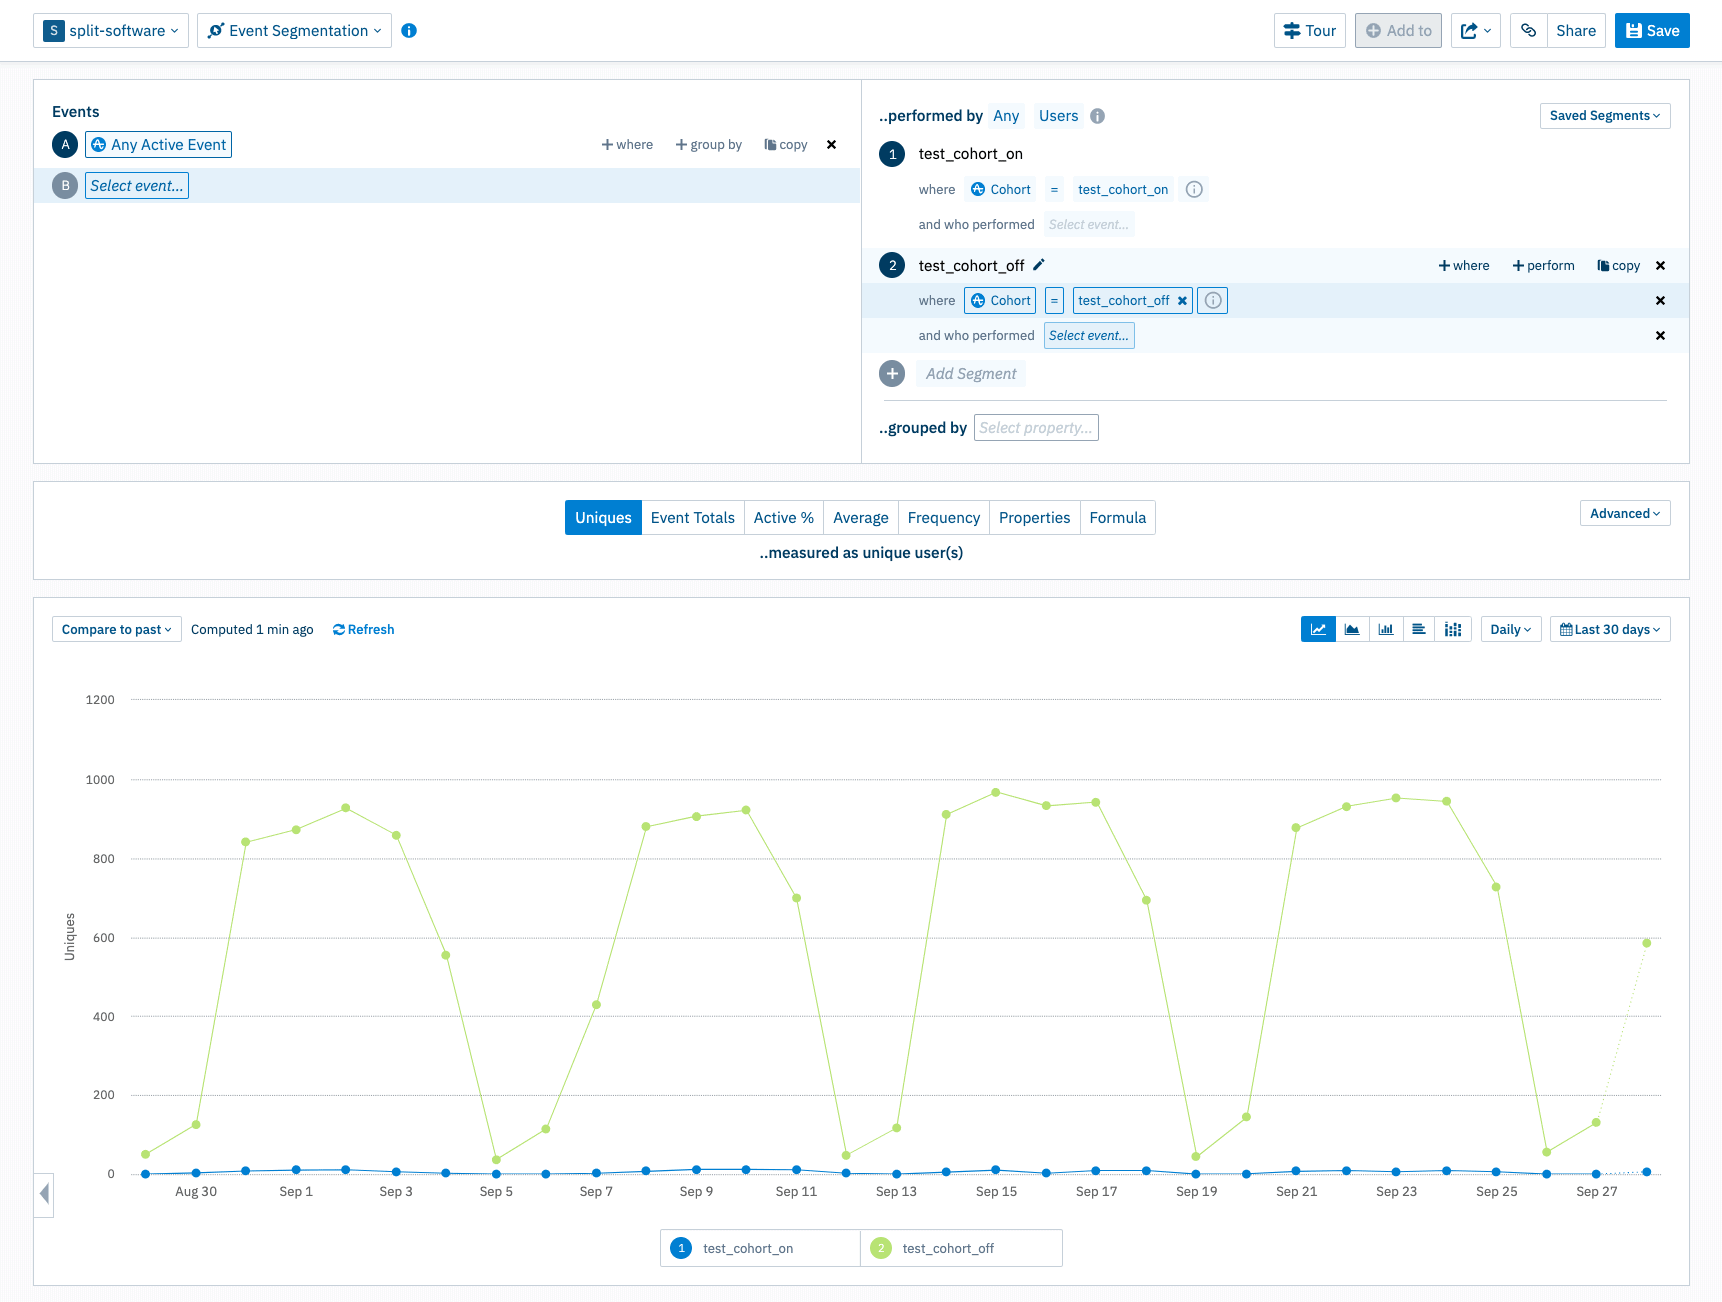
Split’s Amplitude integration combines user and feature data to unlock hidden customer insights, enable faster experimentation, and deliver impactful products. This data source integration sends Split impressions to Amplitude, where they appear as Events and map according to your configuration settings (ex. Split Traffic Type: User → Amplitude Identity: user_id). Once configured, you can create Cohorts in Amplitude based on feature flag variations. For each Cohort, you can then track product usage, map the user journey, and determine which variation produced the most desirable outcomes.
Use Event Data to Target and Measure Experiments in Split
You can also bring Amplitude event data into Split via our out-of-the-box integrations with Customer Data Platforms including Segment and mParticle. From here, you can define metrics by the traffic type (users, accounts, etc.), event type (clicks, purchases, etc.), and how you wish to aggregate the incoming event stream (sum, count, percent, and more). Split will automatically match impressions to users and calculate the effect of each feature on every metric. As you carry out experiments within your product, these metrics serve as indicators of impact and performance, and as guardrails against unintended consequences.
How Our Customers Use Amplitude and Split
As an example, Surfline, the world’s largest surf forecasting site, evolved from feature flags to full-stack experimentation by combining Split impression data with Amplitude user data. When testing out how to offer trials of premium features within their free edition to encourage upgrades, Surfline relied on Split and Amplitude to closely monitor the impact of each experiment on conversion and retention.
Learn More about Split Data Integrations and Working with Event Data in Split
Here are some resources on the topic:
- Watch how to send Split feature data to Amplitude
- View, query, and export all your feature and event data in Split
- Bring your customer and feature data together with mParticle and Split
As always, if you’re looking for more great content like this, we’d love to have you follow us on Twitter @splitsoftware, and subscribe to our YouTube channel.