What is Statistical Significance?
When people discuss A/B testing, they commonly throw around the term “statistical significance” a lot. But what does this mean? In short, getting a statistically significant result means that the result is highly unlikely to be the product of random noise in the data, and more likely to be the result of a legitimate, useful trend. To understand statistical significance in detail, we’ll need to explain three key concepts: hypothesis testing, the normal distribution, and p-values.
Hypothesis Testing
Statistical hypothesis testing is just a formalization of something simple we do all the time. You begin with an idea about how things might be — we call this the alternative hypothesis — and test it against its opposite — which we call the null hypothesis. For example, when you hear water falling on your sidewalk, your alternative hypothesis might be that it’s raining outside, whereas your null hypothesis would be the opposite: that it is not raining outside.
In a more complex experiment with a larger sample size and less clean-cut results, it’s important to verbalize your null and alternative hypotheses so that you can’t trick yourself — or anyone else — into believing you were actually testing something else.
The Normal Distribution
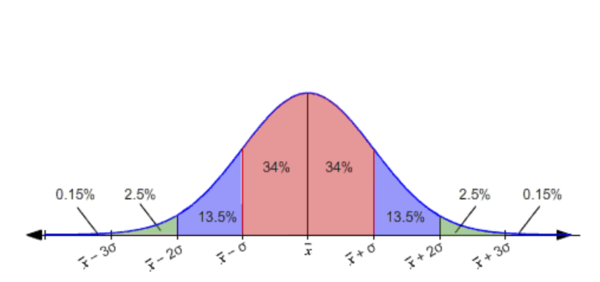
You may have already heard of or seen the normal distribution: it’s also called a bell curve, though it looks a bit more like a rollercoaster than a bell. The center of the normal distribution is the mean (average) of the data set. The steepness of the curves on either side are determined by the standard deviation, which is a measure of how far away the data gets from the mean. If most of the data is close to the mean, the standard deviation will be small and the curve will be narrow; if most of the data is farther from the mean, the standard deviation will be large and the curve will be fat.

P-Values
The p-value is the probability of observing results as extreme, or more extreme, than those measured, in a world where the null hypothesis is true.
Before we begin any experiment, we should decide on a p-value to determine our minimum significance level. This value, commonly called alpha, is most commonly set at 0.05 (which is why you’ll commonly hear scientists and statisticians say that a result is significant “at p<0.05”). However, values between 0.1 and 0.001 are commonly used, depending on the discipline.
When setting alpha for your experiment, be aware that it directly corresponds to your confidence interval. If you have a study done at p<0.05, you can be 95% confident those results are significant, and not a result of random noise. If you use p<0.0000003, as the physicists who discovered the Higgs Boson did, you can be 99.99997% confident the results are significant. Consider the risk of your experiment: you may be alright with a confidence level of 90% if you’re testing a relatively low-impact low-risk feature, whereas if you’re testing something mission-critical you may want a confidence level closer to 99.7%.
How Statistical Significance is Calculated
Putting all these three pieces together, let’s do a simple example with minimal math. Let’s say we have a coin, and our alternative hypothesis says it’s weighted towards heads (which means our null hypothesis is that it’s balanced, aka, not weighted toward heads or tails). We choose an alpha of p<0.05 for our test. Now let’s say we flip the coin 10 times, and 9 times it comes up heads. The p-value for that outcome, according to the normal distribution, is 0.01 — so we have significant evidence to reject the null hypothesis.
That’s it — this really is that simple. Even with more complex experiments, you’ll need about three lines of Python or R code for the calculation of the p-value, and a little bit of algebra for the other pieces.