
Determine the Optimal Traffic Type
Consider the advantages and disadvantages of employing a tenant (e.g., account-based) traffic type versus a conventional user traffic type for each experiment. Unless it is crucial to provide a consistent experience for all users within a specific account, opt for a user traffic type to facilitate experimentation and measurement. This will significantly increase your sample size, unlocking greater potential for insights and analysis.
Important to note: In Split, the traffic type for an experiment can be decided on a case-by-case basis, depending on the feature change, the test’s success metrics, and the sample size needed.
Even if using a tenant traffic type is the only logical choice for your experiment, there are strategies you can employ to increase the likelihood of a successful (i.e., statistically significant) test.
Make a Plan for Lower Sample Sizes
Utilize the 10 Tips for Running Experiments With Low Traffic guide. You can thank us later!
Normalize Data for Tenant (Account) Traffic Types
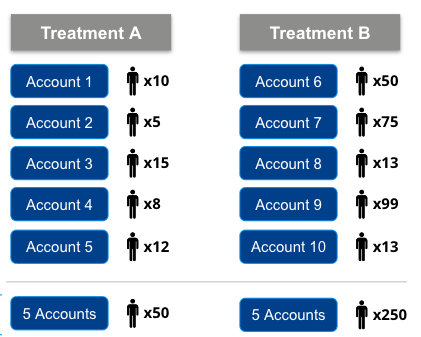
Split’s application ensures that a 50/50 experiment divides tenants according to that percentage utilizing its deterministic hashing algorithm and Sample Ratio Mismatch calculator, but doesn’t consider that some tenants may have more users than others.
This can result in an unbalanced user allocation across treatments, as shown below, using “Accounts” as the tenant type.
The following tips can be applied to normalize the data when users aren’t balanced across tenants:
- Utilize a “percent of” metric type: Use this metric type when the event you want to measure only needs to occur once per tenant to be considered a success (e.g., percent of accounts that upgraded plans). Instead of leveling your users across treatments, it equalizes the data.
- Utilize a “ratio of two events” metric type: Use this metric type when measuring total engagement volume with a feature. This lets you control the numerator and denominator to equalize the metric data.
A reminder: The numerator is set to the event you want to count (e.g., number of clicks to “download desktop app”). The denominator is set to an event that occurs leading up to the numerator event (e.g., number of impressions or screen views where the user is prompted to “download desktop app”). The denominator can also be a generic event that tracks the number of users who saw the treatment.
If you follow these steps, you should be able to overcome most obstacles when running a B2B experiment. And remember: Split offers the unique flexibility to run experiments based on the traffic type that suits your needs. Learn more here.
Get Split Certified
Split Arcade includes product explainer videos, clickable product tutorials, manipulatable code examples, and interactive challenges.
Switch It On With Split
The Split Feature Data Platform™ gives you the confidence to move fast without breaking things. Set up feature flags and safely deploy to production, controlling who sees which features and when. Connect every flag to contextual data, so you can know if your features are making things better or worse and act without hesitation. Effortlessly conduct feature experiments like A/B tests without slowing down. Whether you’re looking to increase your releases, to decrease your MTTR, or to ignite your dev team without burning them out–Split is both a feature management platform and partnership to revolutionize the way the work gets done.
Switch on a free account today, schedule a demo to learn more, or contact us for further questions and support.