
Why Measure?
Software is a team sport. Projects and features are developed and deployed continuously by multiple teams. Everyone is trying to ensure a successful project and satisfied customers. Part and parcel of knowing if a feature release is successful is measuring its impact.
Measuring the impact of a feature will let you know so many things! Did your feature cause a performance hit? Did it cause a great increase in conversion rates or cart size? How do you know? And how do you know that you didn’t negatively impact something you weren’t even planning on affecting?
Split allows you to set up a collection of guardrail metrics that can help ensure that you don’t damage anything that is important to your business. These metrics will be calculated for all feature flags and can ensure that, if and when something goes wrong, you will know about it!
Get the Data
So, the ensuing question that is inevitably asked is, well, how do I measure? And there are many ways to answer that question. To measure, first of all, you need to track the events that happen. You need data – you can send to Split every time a user checks out, clicks an important button, visits a critical feature, and more. Anything that you want to measure, Split can measure. You can use Split’s SDK or Split Suite or Agents to track events explicitly using a track() method to send an event to Split. Split also supports sending events via API and integrations to systems such as AWS S3, Segment or mParticle. We’ve got you covered no matter how you capture this data or want to send it.
Do the Math
Now, once you have this data in Split, and have feature flags to compare how the data looks when the flag is on vs when the flag is off, you need to be confident about the results. Split has a patented attribution engine that can compare and tell you not just that there was a degradation in a metric, but it can tell you which individual feature was causing it! This means that you can roll out to small percentages of users, reducing the blast radius, while still being able to have that safety to ensure you’re not breaking any of the guardrails and won’t cause any problems when the flag is rolled out more broadly to a larger population of users.
As part of this attribution engine, we need to compare who got a feature to who didn’t get a feature. And these two groups have to be statistically equivalent in every other way.
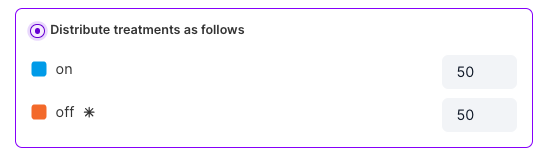
Split allows you to use percentage-based randomization to split (see what I did there?) your population of users into two (or more) distinct groupings for analysis.
Split will automatically calculate any metrics attached to flags that have a percentage based rollout. In fact, it isn’t possible to do statistically valid calculations when NOT rolling out with a percentage based rollout. Otherwise you could have bias creep into the calculations.
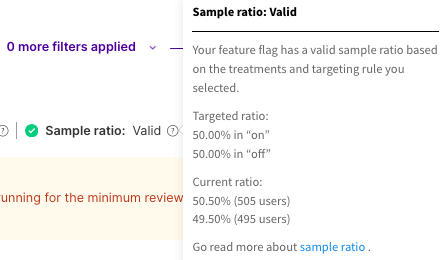
As you monitor the metrics attached to the flag, Split will calculate the sample ratio to determine if the groups are close enough in population to ensure validity of the metric calculations.
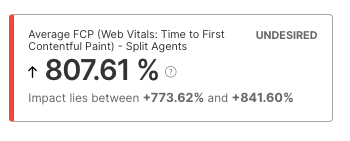
Above you can see a feature that really killed one of Google’s web-vitals statistics. These are included out of the box in Split’s Browser RUM agent and Browser Suite.
But..?
A common concern when doing a percentage-based rollout is the uncertainty of who actually gets to see the feature. In larger organizations or those with B2B customers it’s quite possible that you have sensitive customers or collections of customers that you don’t want to potentially show new features to. Even if you’re not in B2B you might have geographies that are more sensitive. Possibly you might want to only experiment with new customers and leave the experience the same for your long time users. You may also need to see who got a new feature in order to sync up account and customer success managers in case of questions coming back.
All of this can be done with Split. Let’s see a few different scenarios.
Only New Customers
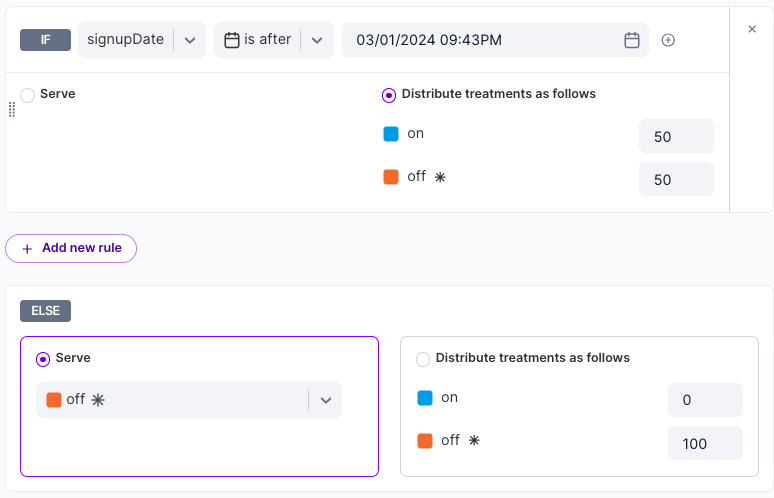
Let’s say you want to only have your feature flag turned on for new customers. You have an existing set of customers that you want to remain blissfully unaware that things may be changing around here!
You can use a date-based matcher in Split to ensure that only customers that signed up after a certain date can get exposed to the new feature.
In code, you would need to pass a signupDate attribute to the Split SDK. In node that would look like this:
var treatment = client.getTreatment(userId, ‘flag_name’,{signupDate: signupDateInMS} );
The signup date passed would be in milliseconds from the unix epoch.
Special Customers to Exclude
Let’s say instead you want to exclude certain customers from the experiment. Your friendly_customers. You can exclude them from being exposed to the new feature by placing them into a segment. That configuration would look like the below:
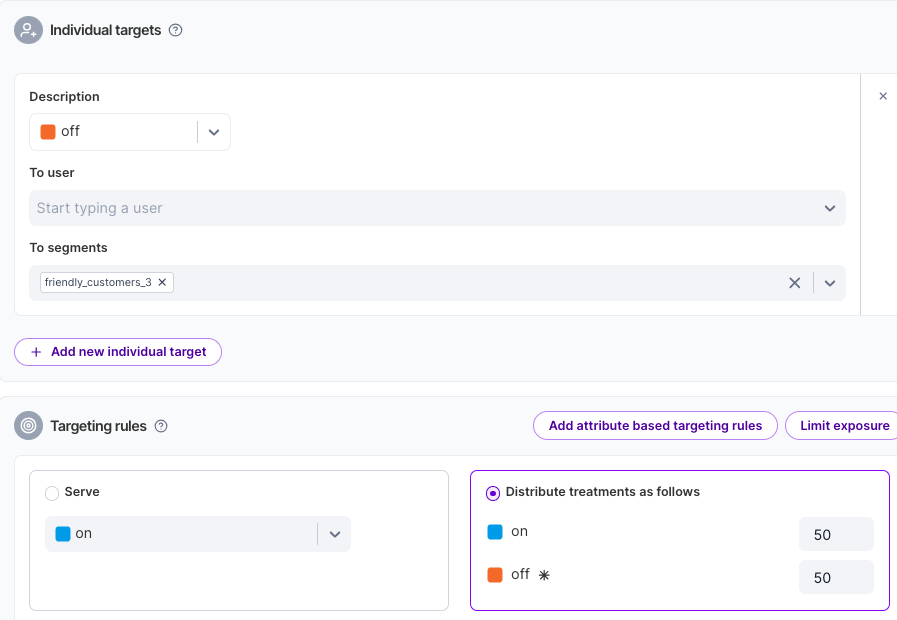
Then, any customer in that segment would get off, and the rest could be part of the experiment.
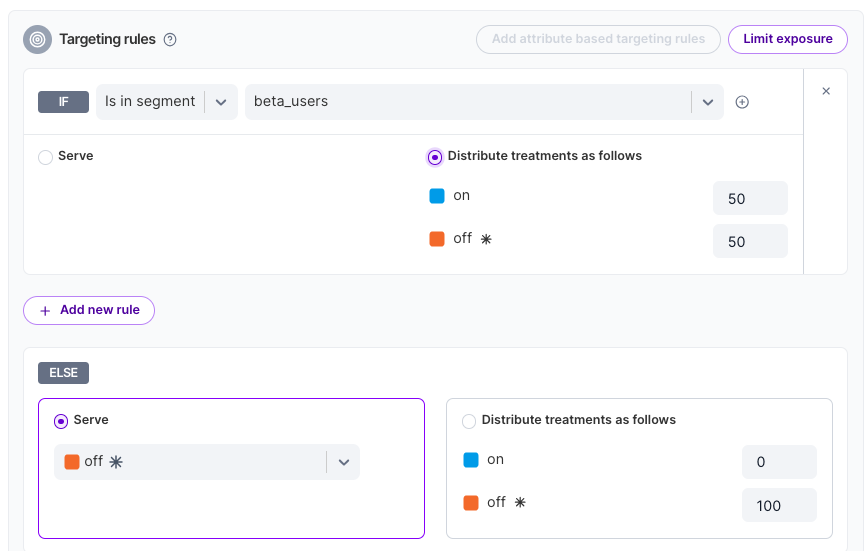
Special Customers to Include
You could also do the opposite if you have customers that have opted in, or groupings of customers that you want to experiment with. You can experiment with your beta users while leaving the rest of your customer base untouched.
Who Saw the New Feature?
Inevitably if you have sensitive customers of some kind you might also want to know who saw the feature and when as a running feed. You can do this a few ways with Split.
Webhook
Split’s Impressions Webhook allows you to capture each impression event and forward those along to a downstream service. This can be useful if you are able to build a small service to capture these impressions and send them to a database or data warehouse of some kind. You can use these collections of records to see who got a feature, and when they saw it.
AWS S3
Split also supports an integration with Amazon’s S3. Impressions can be placed into a S3 object storage bucket and retrieved from there, allowing you to process them as needed – such as ingesting the data into other business intelligence or data systems. It’s another way Split makes it easy for you to ensure you have the data you need to make critical business decisions.
Manual Downloads
Finally, if neither of those are possible for you right now, don’t fret! There’s still a way to manually download data. You can use Split’s Data Hub to download data in CSV format. You can filter it by the feature flag, by the user key, or by the treatment. This way you can get the data you need and can keep the data volume manageable if you’re only interested in in high value flags, users, or specific treatments received.
Predicting the Future
But, there are certainly circumstances and situations where you need to know beforehand what treatment someone might get. Let’s say you have collateral prepped for explaining this new feature and want to let the customer know that they’re going to get it and how it might help them. And here too in a B2B environment you kind of need to have your cake and eat it too. You need to be able to have randomized bias-free groups but also know who is in those groups beforehand. Sounds like a contradiction? Not really!
With Split’s feature to turn off SDK impressions, you can indeed write a small bit of code that will tell you which users will get a feature and which will not. And you can do this without Split sending back to Split that the user entered the experiment at that time. So you can know who will be getting the feature without Split using that information as part of its statistical calculations – neat!
Here’s what it could look like using NodeJS – but any of our SDKs support the impressionsMode of NONE
var SplitFactory = require("@splitsoftware/splitio").SplitFactory;

var factory = SplitFactory({

  core: {

    authorizationKey: "SDK_KEY",

  },

  sync: {

    impressionsMode: "NONE", // make sure that impressions are not counted for experimentation

  },

});

var client = factory.client();

let b2b_ids = [

  { id: "user1", attributes: { attr1: "val1", attr2: "val2" } },

  { id: "user2", attributes: { attr1: "val3", attr2: "val4" } },

  { id: "user3", attributes: { attr1: "val5", attr2: "val6" } },

]; // your user ids -- read this in from a file or database if it's big

client.on(client.Event.SDK_READY, function () {

  b2b_ids.forEach((b2b_id) => {

    var treatment = client.getTreatment(

      b2b_id.id,

      "sensitive_feature_flag",

      b2b_id.attributes

    );

    if (treatment === "on") {

      console.log(`User: ${b2b_id.id} gets on!`);

    } else if (treatment === "off") {

      console.log(`User: ${b2b_id.id} gets off!`);

    } else {

      // insert control code here

      console.error(`SDK ERROR`);

    }

  });

    client.destroy();

});
You could write the treatments to a file and iterate through all of the B2B ID values that will see or that you expect to use your app. Make sure to also pass in their attributes! This way you can inform account managers and other teams that support customers about who is going to get a new feature and who will not. And you won’t affect the experiments.
Wrapping Up
So in conclusion, you don’t need to fear the percentage based rollout. In fact, it is quite necessary in order to get the most value out of Split. To measure, you need statistical validity, and to get that you have to have groupings free from other kinds of bias. And the best way to do that, is to randomize the treatment, like we do at Split.
Switch It On With Split
The Split Feature Data Platform™ gives you the confidence to move fast without breaking things. Set up feature flags and safely deploy to production, controlling who sees which features and when. Connect every flag to contextual data, so you can know if your features are making things better or worse and act without hesitation. Effortlessly conduct feature experiments like A/B tests without slowing down. Whether you’re looking to increase your releases, to decrease your MTTR, or to ignite your dev team without burning them out–Split is both a feature management platform and partnership to revolutionize the way the work gets done. Schedule a demo to learn more.
Get Split Certified
Split Arcade includes product explainer videos, clickable product tutorials, manipulatable code examples, and interactive challenges.