For any website or web application, one of the most valuable events you can track is the act of a user loading or viewing a page. After all, your site is just a collection of one or more pages, and every visitor views at least one page by their definition. When tracking page view events, the use of properties enables you to encapsulate a significant amount of relevant data from which a wide variety of metrics can be built. Page views provide information on the customer journey, measuring a user’s level of engagement with each part of the application and the relationship between those pages and key actions that are important to the business.
Event Tracking
Tracking of page views differs depending on the structure of the application. For more traditional websites, tracking navigation simply requires firing a page view event on document load, while modern web frameworks are built as single-page applications which use navigation between pages to fetch, swap, and render new assets within the same browser page. Fortunately, most frameworks offer explicit hooks for when navigation starts and ends. Those hooks can be used to trigger page view events in addition to the general document load event.
Page View
Many implementations of page view tracking fire dedicated events for each type of page on the site that is of interest from a tracking perspective, for instance, using separate “home.page_view” and “product.page_view” events. But by consolidating these into a single “page_view” event type, the metrics built from those events can have greater flexibility. The event should still contain properties for the loaded page, such as the URL or an explicitly defined category (home, search, PDP, settings) to provide additional analysis opportunities. The customer journey can also be tracked by either storing elements of that progression in the session state or by extracting the document referrer to isolate down to where the visit originated.
Session-specific data can be used to provide dimensional information. Parsing of the User Agent will report the browser and operating system types and versions. User location is accessible through the HTML5 geolocation API (if users opt-in) or by performing a lookup of the IP address using a geolocation service. Depending on the browser, connection and network information can be accessed to see how that might be influencing page performance. Each of these dimensions provides additional avenues for analysis and targeting.
Each page of the site may also have specific properties relevant just within that context, so it is helpful to provide hooks for tracking that data and the standard navigation and user information. A product page view may want to include data on the product category, identifier, cost, or even state information like active discounts or offers.
Other pages may contain paywalls that may or may not show for the user given their plan, and the state of those paywalls would significantly impact the engagement on that page. Many applications have search functionality embedded into them. Knowing the number and quality of those results can help inform the search’s performance and the user’s happiness with the results. In some cases, this data may be best served as a separate event from the page view. In other cases, they are essential properties of what is being loaded – how to track the event is usually best determined by whether that data only happens alongside the page view and if the properties are always available with that type of page.
Finally, page views can also incorporate page load performance information. There are several stages in the page load process, whether it be time to visibility, interactivity, or completion of network requests. These days most modern browsers support the navigation timing API, which supports quick access to these timings. The article on page load performance explores this measurement and its related metrics in more detail, but when tracking events, these two topics are closely related and can often be merged into a single event type. The Split reference application combines these two measurements in this way.
Metrics
Similar to interaction metrics, page views serve as engagement indicators, milestones along the conversion funnel, and as conversion goals themselves. Which of those purposes a particular page serves depends on the application, the page, and the context of the current change. In one instance, the search results page may be a step in the workflow towards a goal, while other changes may have a goal of impacting search behavior directly. There can even be cases where search behavior is an unintended side effect of a completely unrelated change. As a result, it is common to build many distinct metrics based on page views, just changing the particular properties of the pages involved.
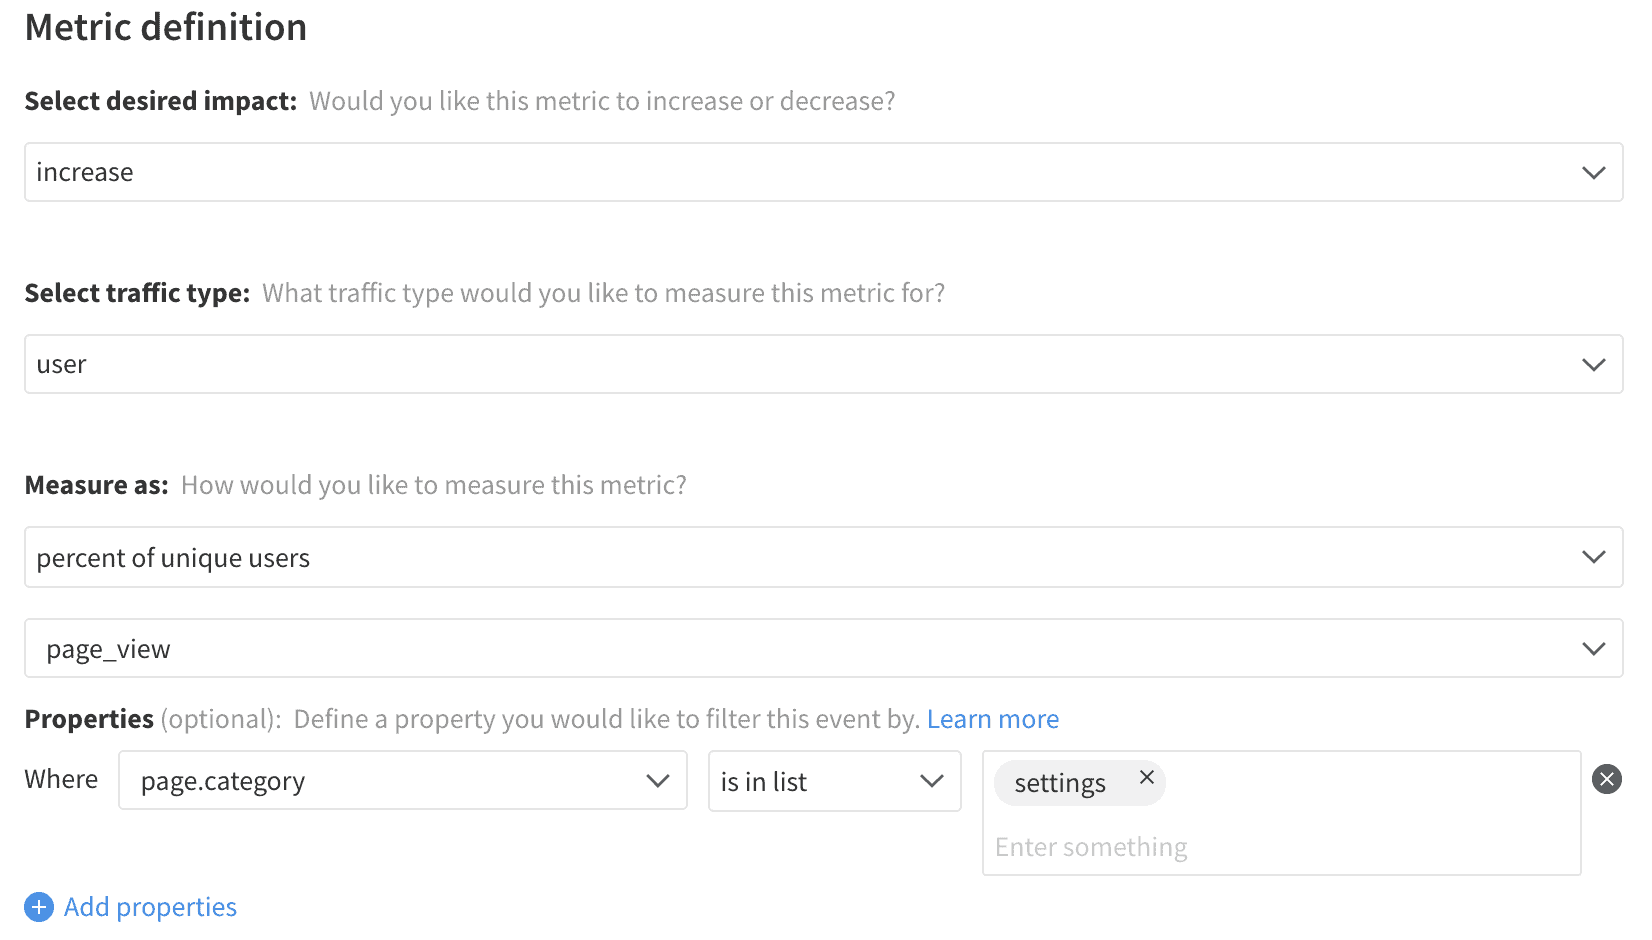
The primary metrics derived from page view events are the page view rate and page view count. The page view rate tracks what percentage of users ever visit that particular page. Without a filter, this rate should always be 100% (as the users measured are the ones visiting your product), but with filters, this can provide insight into each page category in the application and even allow for further slicing by the content of those pages. From an engagement perspective, this metric helps understand where the application is delivering value, but it also performs as a conversion rate when the page view is acting as a goal.
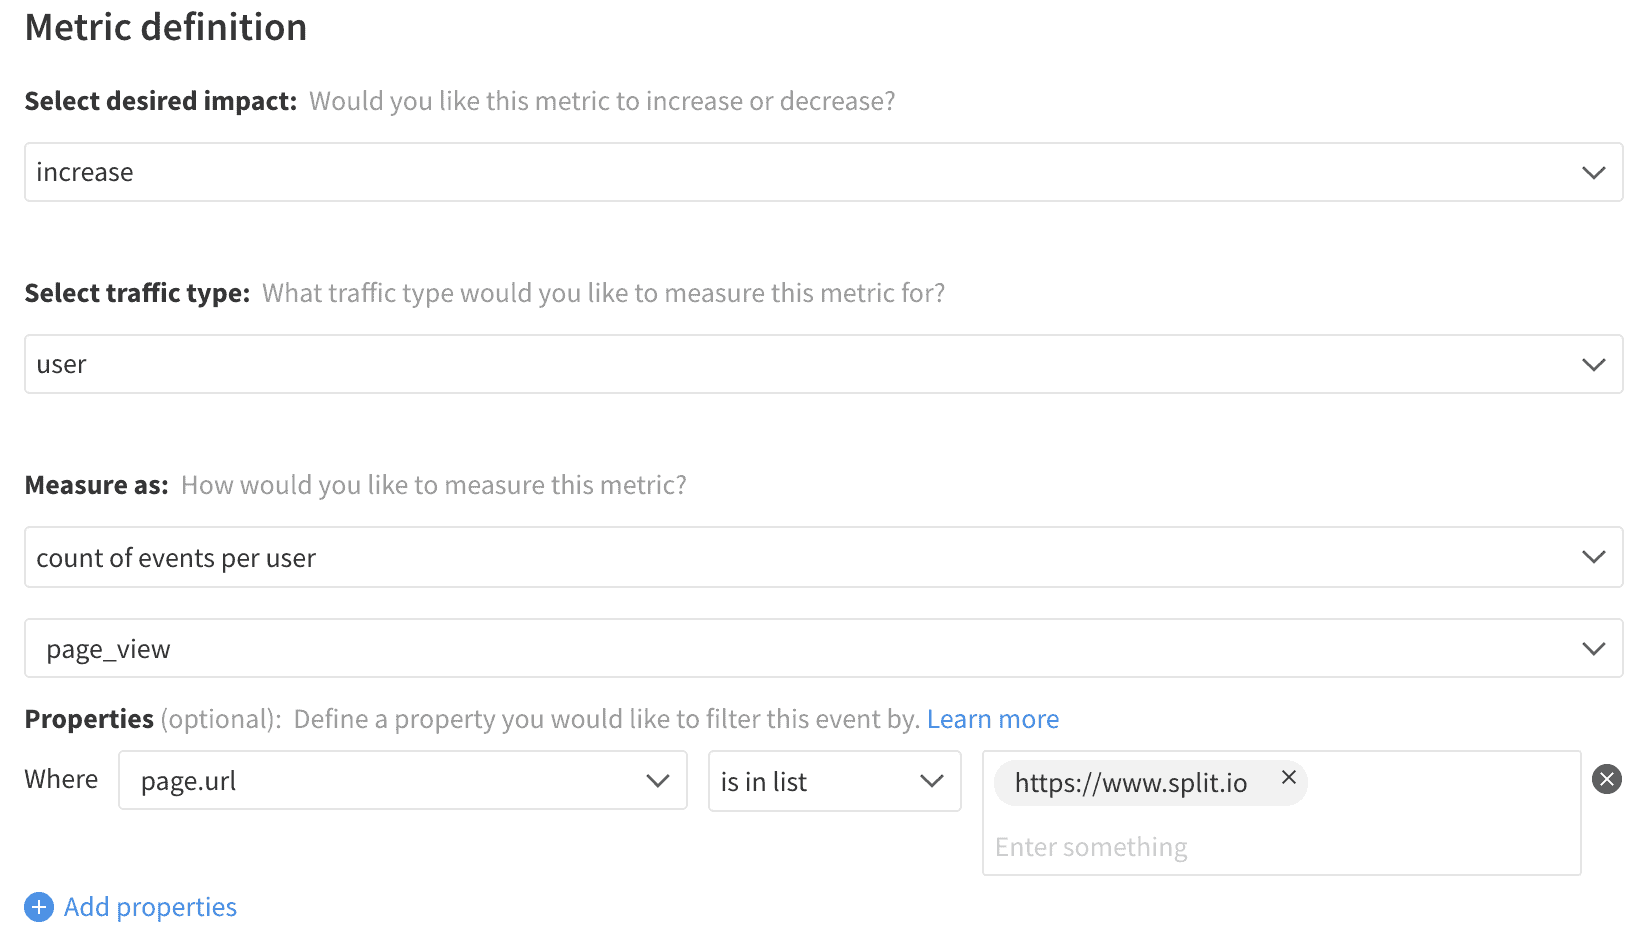
Most customers will visit specific pages, but the degree of that engagement is what matters most. The page view count metric shows the average number of times users visited the page, and again is most valuable when filtered by the properties on the event. In this case, there’s value as an unfiltered metric as well, as it shows the overall engagement across the product.
Comparing how many page views occurred for one page against another or against some other event like a session or purchase helps provide context for these events. They can be treated as conversion ratios, whether the action is the goal of the change or simply a guardrail measurement for user behavior. They can direct your business or identify issues in your funnel that have yet to appear in the core value metrics.
Page View Count
Page View Rate