
As your team’s adoption of Split grows (which is great!), so do the number of Splits, Segments, and Metrics. As part of our regular feedback sessions with customers we’ve heard this singular common theme — how do I organize and find what is relevant to me and my team? As a product team, one of our common themes is “support for larger organizations”. This theme has laid the foundation for several key features including tagging, now starring, and a few other enhancements already in production (but of course behind a Split!). Today we’re releasing starring to all customers. However, what is a release without testing and analytics to help inform our decisions? One of the best things about building product at Split is getting to use our experimentation and analytics capabilities to understand how our customers are both discovering new functionality and engaging with the product.
Testing different variations in production
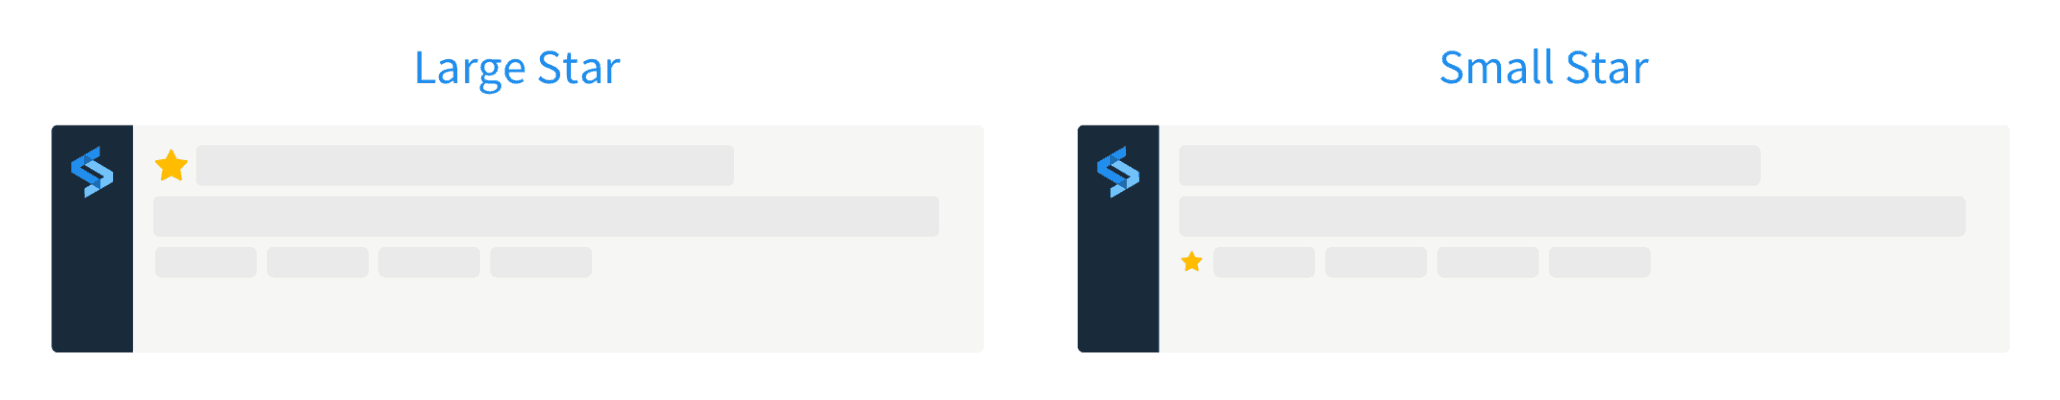
You may have noticed stars appear in the application a few weeks ago. But did you notice when looking at your colleague’s screen that your stars were in a different position? While the two treatments represent a small change in the visual design, the results of the experiment we ran were counter-intuitive to our entire team, in fact, our entire company. When designing our starring functionality we looked to a number of tools to understand how isolation and starring were visually treated across the market. It became clear there were two visual paradigms for how stars were visualized:
- a “large” star in front of the object name (equivalent to starring in Datadog)
- a “small” star in the metadata of the object (equivalent to starring in Slack or SumoLogic)
What we’re looking for
When we released this functionality we were focused on two primary categories of metrics — discovery and engagement.
- Discovery focused on were users able to find the new starring functionality; and
- Engagement focused on the number of times users were starring and the number of starred items they maintained.
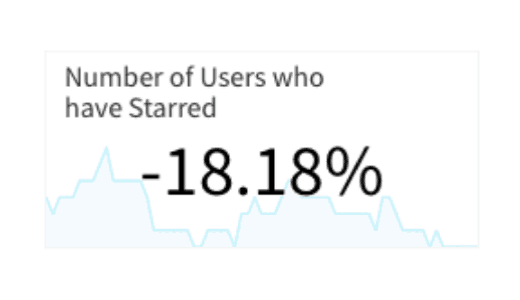
Our hypothesis was that the large stars would be both more discoverable and drive more engagement. Let’s quickly look at the results that drove our recent product team’s decision. As was expected, smaller stars were less discoverable. 18.18% fewer users in Split starred when exposed to the small star versus those exposed to the large star.
An unlikely conclusion
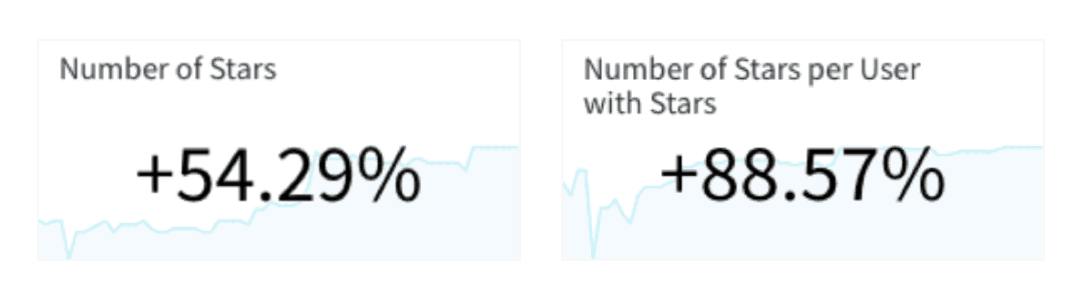
However, contrary to what we expected, smaller stars drove higher engagement. There were 54.29% more stars across users exposed to small stars, and the number of stars per user with stars was 88.57% higher.
Summary
After evaluating these results, we have decided to enable small starring for 100% of customers, preferring to sacrifice discoverability for continued user engagement and continued happiness. We will continue to monitor discoverability and we hope to see you engage with starring as it was designed. Star away and stay tuned for more enhancements focused on our product theme of “support for larger organizations”.
Get Split Certified
Split Arcade includes product explainer videos, clickable product tutorials, manipulatable code examples, and interactive challenges.
Deliver Features That Matter, Faster. And Exhale.
Split is a feature management platform that attributes insightful data to everything you release. Whether your team is looking to test in production, perform gradual rollouts, or experiment with new features–Split ensures your efforts are safe, visible, and highly impactful. What a Release. Get going with a free account, schedule a demo to learn more, or contact us for more information.