An application’s active user count measures the number of unique users who have engaged with the application during a given period. This metric is most commonly measured over a fixed or rolling time window, whether monthly, weekly, daily, or an instantaneous measurement of active sessions.
This metric requires some tracking event that is common to all users, commonly a session start or page view event, and then counting the unique keys that had such an event in the given time window. As a single measurement, it can act as a proxy for the business’s size, but it is most useful as a tool for decision-making when viewed over time. The rate of change in active user counts, or the ratio between time windows (for instance, DAU / MAU), can provide insights into growth, engagement, and user retention.
There are issues with active user metrics to be aware of. The measurement does not discriminate between new and returning users of the application. As a result, a significant investment in new user growth could increase the active user count, but those users may not continue to engage with the site beyond their initial visit. In such a case, the business would miss out on the compounding growth of returning users, and the active user count could drop significantly when the investment in new user growth changes. From a product perspective, that new user growth is outside of the realm of influence, as, by definition, those users have not yet experienced the product. Therefore, product and engineering teams typically see greater value from focusing on metrics that measure those returning users; both in how frequently and for how long they continue to return.
Within Split, metrics are measured based on the influence of a given feature release. The measurement performed by Split is limited to the users exposed to the feature, the activity that occurred during a particular phase of the release, and the exposure of users to the feature is tied to a rollout plan that often involves imbalanced rollout percentages or targeting specific attributes. All of these result in the active user count metric not being an effective measure at the feature level in the way it is at a business level. Instead, metrics focused on measuring engagement and retention provide a more explicit indicator of how a feature will influence total active users.
Event Tracking
To know the number of active keys exposed to a feature release, Split already provides out-of-the-box tracking through our impression tracking. Each exposed user generates an impression which tells us of the exposure and Split provides exact counts of these exposed keys for each treatment and rule on the Metrics Impact page.
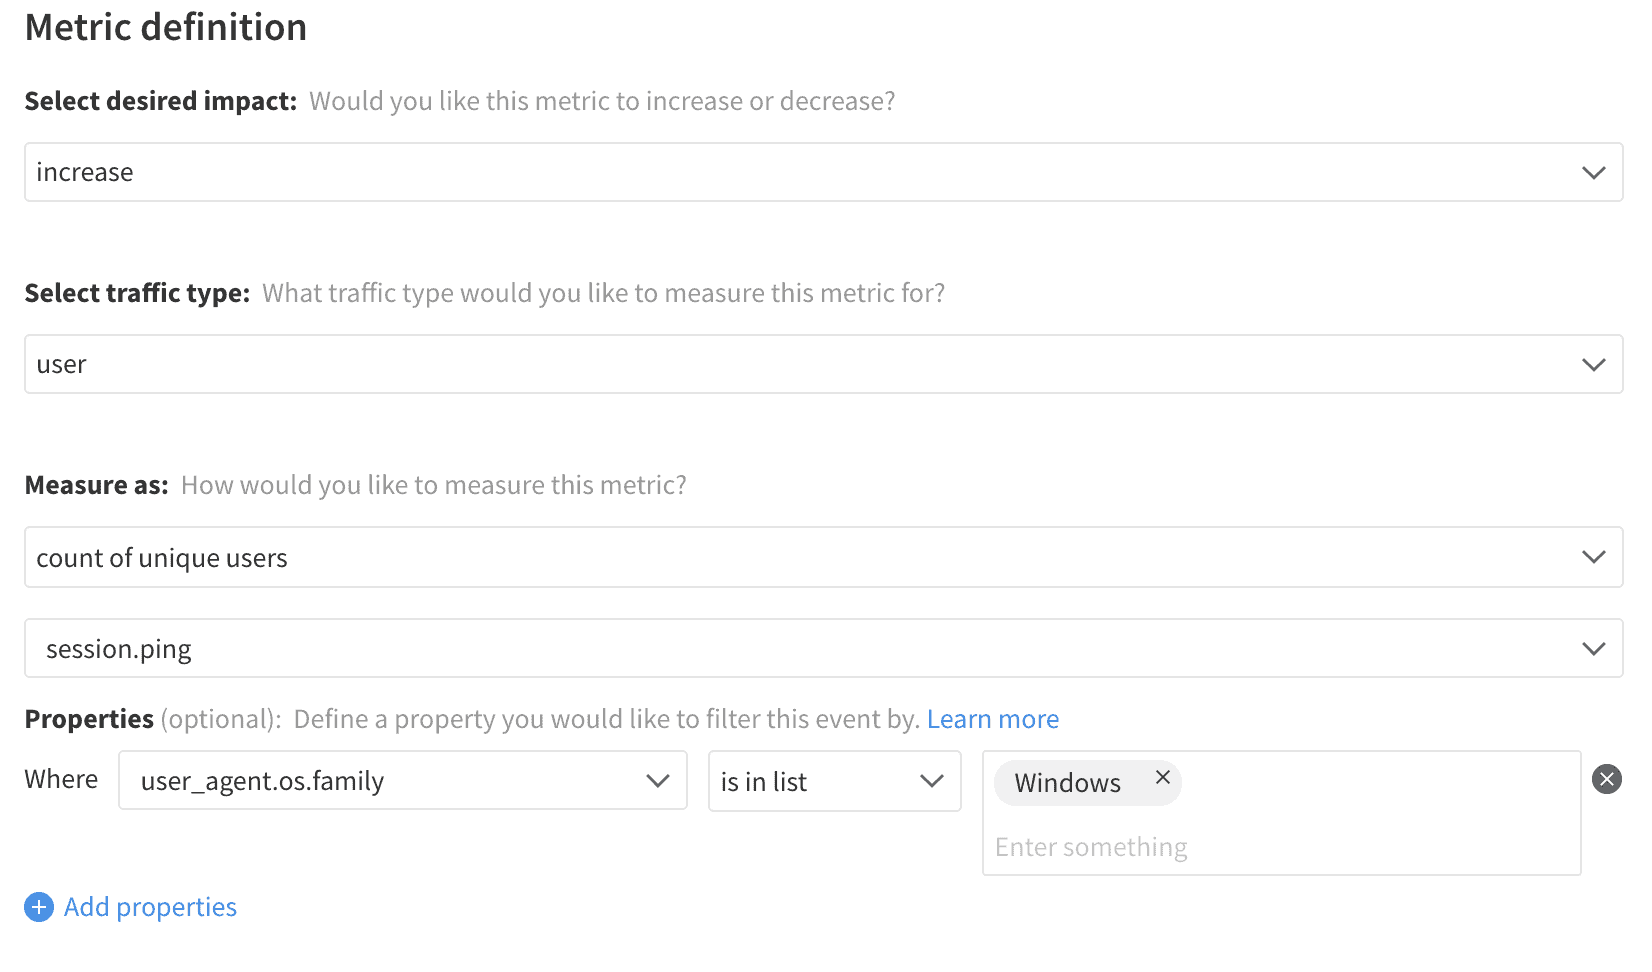
It may be preferred to isolate active user counts based on the user’s activities or demographics (location, browser type). In such cases, it helps to create a metric, which must be built with an event that any active user will perform. Traditionally this is a session start or a page view. However, in a feature measurement context, only events which occur after the user’s exposure to the feature are captured. As a result, the session will have already started, and the user may not move to view another page during their session, so this active user would fail to be counted towards the metric. Instead, using the session ping event (if available) is the best way to increase the coverage for all users.
Metrics
As discussed above, active user counts for a particular feature can be easily accessed in Split without creating a metric. This metric has some risk for inaccuracies due to the difficulty of generating a consistent event for all users but can help in specific circumstances. Calculation of total active users as a metric can use property filters to observe which users actively meet that criteria.
As the number of active users is dependent on who comes to the site initially, it is challenging for features on the site to drive that adoption behavior. A more robust measure for feature-related use cases is tracking the return rate of users after a period of time. That is more likely to be impacted by the experience the user had in the product.
When viewing the total active users metric on the Split Metrics Impact page, note that statistical analysis is not available for this metric, as it simply represents a total count across all users exposed to the feature. The metric can be used as a helpful reference and, for debugging purposes, but it lacks decision-making power.
Total Active Users