Most metrics act as a proxy for how happy a user is with their experience with a product. They track engagement levels, whether users return to the site and if they are completing the actions that deliver value to the user. Sometimes, the best way to know what a user thinks about a given product or feature is simply to ask them. User feedback can take many forms, from a simple thumbs up button to indicate approval to a multi-question survey gathering qualitative insights about the experience. One of the most popular measurements of user satisfaction is the Net Promoter Score, which asks for a 1-10 rating of how likely the user is to recommend and then compares the proportion of respondents who are promoters or detractors.
Surveys should be presented to customers carefully, with steps taken to avoid soliciting multiple responses from the same user. In some cases, these surveys would be presented to those who meet specific criteria (such as those who created their account in the past week) or those who complete a particular workflow that should be measured (completing a checkout flow). Surveys can also manifest as a recurring question to see how the organization is performing over time. One note when designing feedback methods is to consider that responses will need to be attributed back to an identifier that can be used to correlate the response with feature exposure and other behaviors. Some feedback is best collected anonymously, so a decision needs to be made about the response’s nature to determine if that is the case.
Each feedback method has its purpose, and significant research has been put towards each approach’s pros and cons. It is essential to keep in mind that a survey is more likely to be responded to by those with polarized feelings, and whether a user responds to the survey is valuable data. While these feedback methods can and should also be applied for customer reactions to products or content on the site, those responses are often more meaningful as user interactions unless the sentiment is used to judge the value of recommendations made by the product.
Event Tracking
There are plenty of tools available for collecting satisfaction responses. While it is usually quite simple to ask for a thumbs up or rating directly within the product, it is common to solicit this feedback by email or form. Those external sources may have the ability to fire events into Split, but if not, the results should be extracted and then uploaded to Split as feedback events. As with other form submissions, tracking exposure and completion rates can provide valuable context beyond just those who are responding.
Feedback
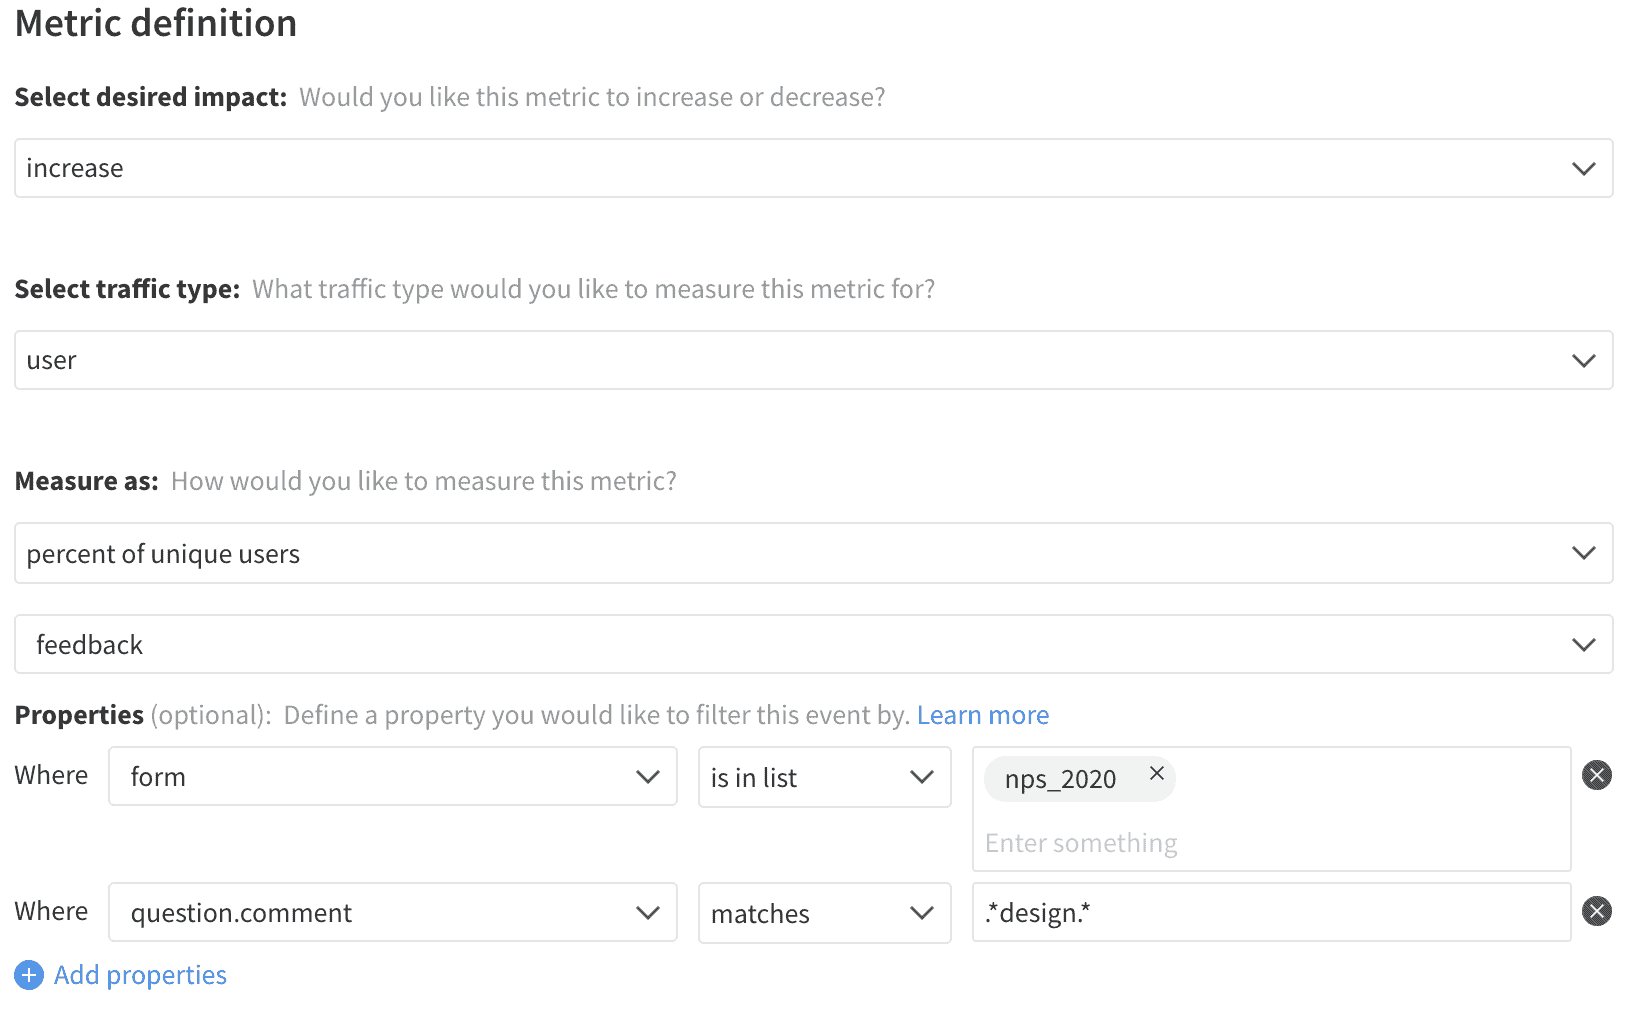
Feedback events should be separated by the survey being delivered by creating separate event types or, more commonly, by adding a property for a unique identifier of the survey. Metrics can then be built that focus specifically on the survey in question. If multiple responses are solicited in the same questionnaire, each question’s response can be included as a property by name or with some key.
Measurement of the response can then be performed by building the metric off of that specific response. In most cases, metrics are most effectively built from numeric questions (a star rating, a score from 1 to 10, etc.) as those results can easily be aggregated. It is worth noting that most rating systems see a heavy skew to the extremes in their results, so it can help provide some form of standardization to the value. It is also possible to analyze categorical data or even free text data by extracting those categories into distinct metrics and measuring the occurrence rate of that category in the feedback.
If tracking views of the feedback form in addition to responses, it is also necessary to provide a property indicating if a response was provided or if the event just is an exposure to the form.
Metrics
Each satisfaction survey presented to customers requires its own set of metrics to understand the engagement and responses to that feedback. When a single positive reaction is provided, measuring the response rate for that action gives a sense of how it is received.
Categorical data uses a similar approach, but instead of looking at the rate users provided feedback, we instead look at the occurrence rate of a given category in the responses that were received. These categories may directly exist in the question, derived by grouping specific scores together or extracted from free text by looking for a set of terms.
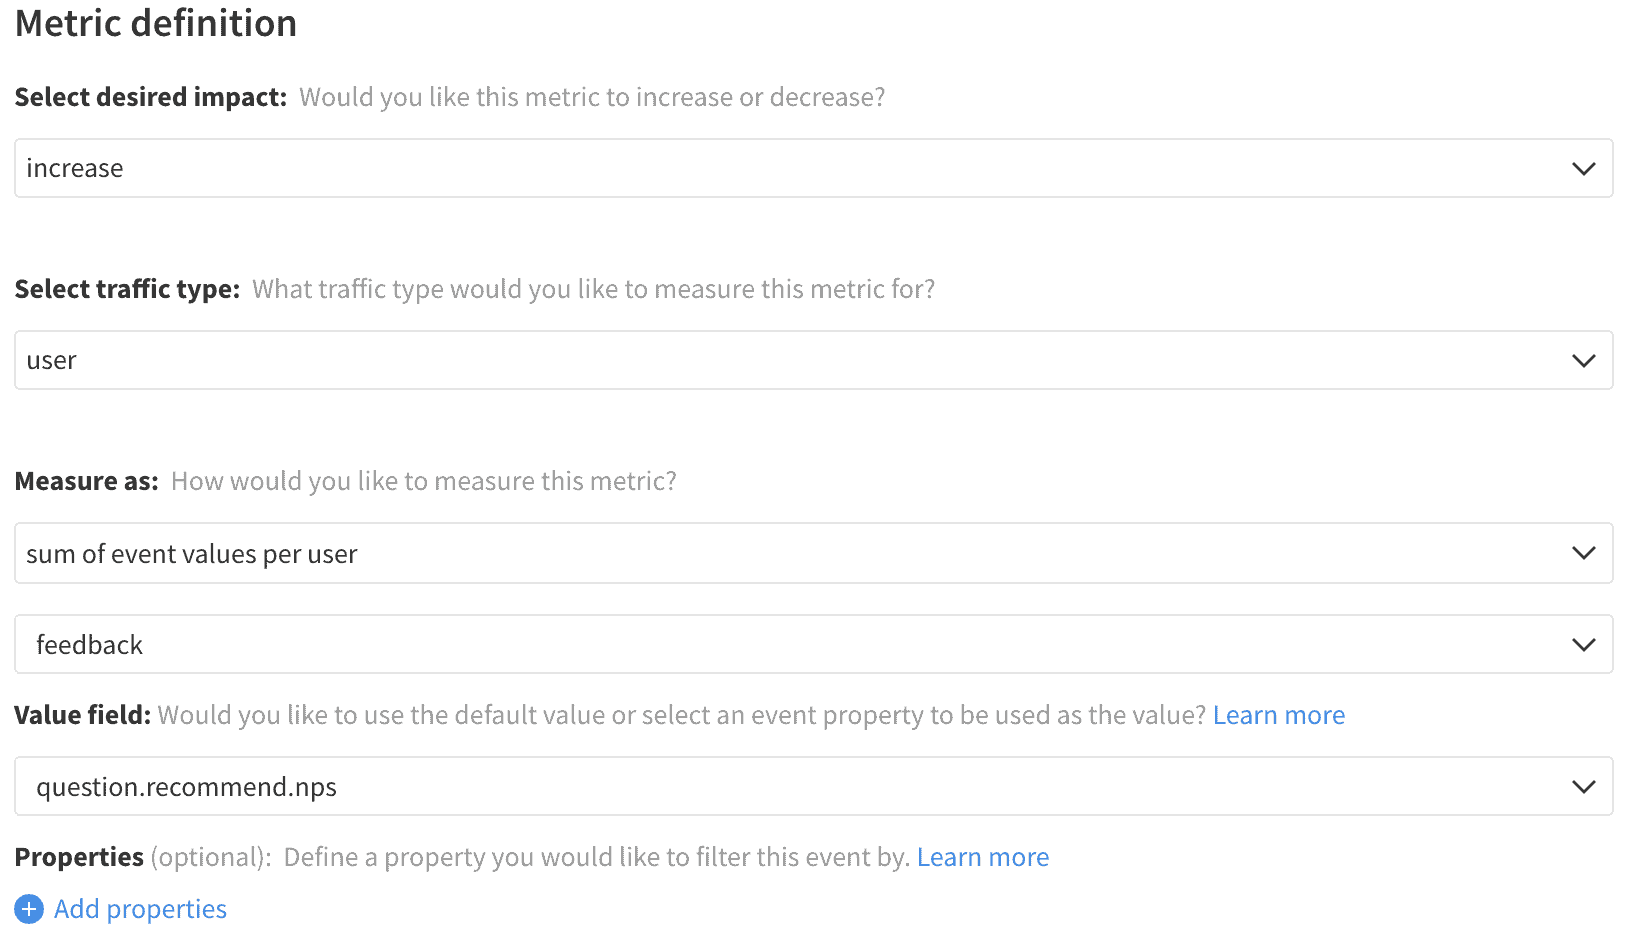
For feedback that generates a numeric response, this data can be either directly aggregated into an average feedback score, or the same calculation can be applied across some standardized version of that value. For instance, the Net Promoter Score calculation would require a property to store how the response contributes to the final score. Promoters (scores of 9 or 10) would contribute +1, detractors (scores 1-6) would have a value of -1, and the passives (scores 7 or 8) would return a 0.
Feedback Occurrence Rate
Average Feedback Score

Net Promoter Score