All businesses require income to survive, and most modern digital applications are designed to facilitate that income generation. This can take many forms, whether it be the direct sale of digital services through the application, an ecommerce store facilitating the purchase of goods and services or a donation form in the case of charitable organizations.
Additionally, some businesses receive their revenue outside of the application through an invoicing system, but those sales can still be tied to users or accounts within the digital experience. While aspects of the sales cycle may mean that external sales’ timing may not correlate with active feature releases, capturing that data can still be of value when viewed as part of the entire user experience. We will primarily describe purchases here in the context of a traditional ecommerce store. Still, the events and metrics described also transfer over to any other types of purchases made in association with your application, whether donations, contracts, or even digital currencies in a video game.
Event Tracking
Purchase events occur when a sales workflow (like checkout) is completed in the product, or an external contract is signed or fulfilled. From a tracking perspective, all that is required in its simplest form is an event that contains the value associated with the event.
For transactions occurring outside of the product, they will be triggered by a hook within your sales or invoice application or through a regularly scheduled script which would scrape your sales history for events. When the product does initiate a purchase event, that purchase can be fired either through a customer interaction, such as clicking the purchase button, but there are cases where issues can occur in the processing that would fail the purchase request. It is usually safer to fire a dedicated purchase event from your sales processing system rather than the client-side application for this reason.
Purchase
There are many ways to measure the value of a sale, and so it is often best to track several properties if available. For instance, if sales are made in various currencies, it is helpful to track the sale currency, the localized value, and a normalized value converting the currency to some standard, which can then allow for comparison across currencies. In the case of tangible goods and services, it may be possible to track not just the user’s price but also the associated base cost or the net profit on the sale.
There are many other dynamics to the purchase (number and types of items, shipping charges, active sales, etc.), which can also be incorporated into sales events which can empower the creation of a wide variety of useful metrics. For full details, see both the metrics and related metrics sections below.
As always, but especially when dealing with financial transactions, carefully review the shared properties for sensitive or private information before sending to third-party vendors.
Metrics
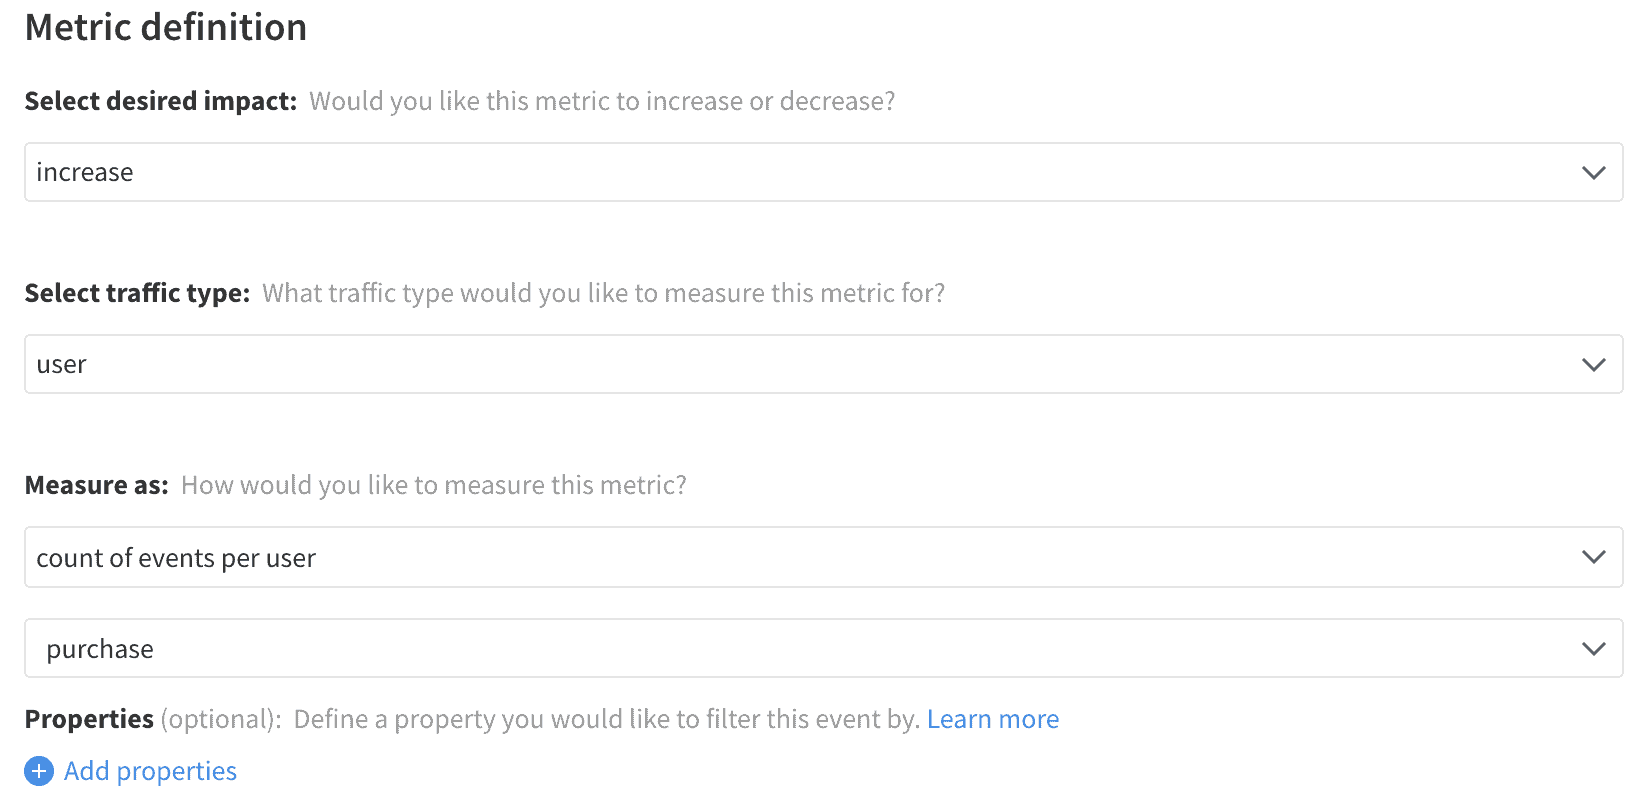
For a business, the core metric that is most relevant to a feature’s success is the total purchase value each customer generates. However, for a typical application, you may have many sessions which do not generate any purchases, and when a purchase does occur, the value of that purchase could vary significantly. This broad spread of possible values for each customer can create a highly variable metric. Higher metric variability equals less sensitivity to change – meaning longer feature rollout times. This does not mean the metric is not helpful, as a large customer base or a significant improvement in purchase values will show conclusive results, but that metric can also be decomposed into its related metrics, which each have higher sensitivity and can help tell the complete picture.
An increase in total purchase value can be caused by an increase in any of three areas: the number of users making purchases, the number of purchases those users make, and the average value of each purchase. A change in total purchase value may be caused by a change in any of these other factors or could be the result of the interaction between multiple factors. For instance, a sale may increase the purchase rate and purchase frequency, but reduce the average purchase value.
The degree to which those three areas interact will determine the effect on the total purchase value per customer, as marking down a price by 90% may make sales go through the roof but cause you to lose money overall. This dynamic between the four dimensions of the purchase value should be applied regardless of whether the value measured is the total purchase price, the net profit realized, or any other relevant cost of the purchase.
It is important to note, though, that a significant change in the purchase rate resulting from a feature change will skew the size of the samples used for the purchase frequency and average purchase value metrics. This creates a mismatch with the intended rollouts sample ratio that can affect the metrics analysis accuracy. You can learn more about in our article on sample ratio mismatch.
To track purchase frequency without the risk of sample ratio issues, including measurement of the Purchase Count metric, will provide similar results at a lower sensitivity.
When customer purchase values range widely, it can be more effective to segment the values into categories. Determining low, medium, and high-value purchase bands allows the purchase rate to be analyzed for each band separately. A given feature may not significantly improve sales at the low end of the spectrum but could improve the conversion rate of high-value purchases and thus be a significant driver of business.
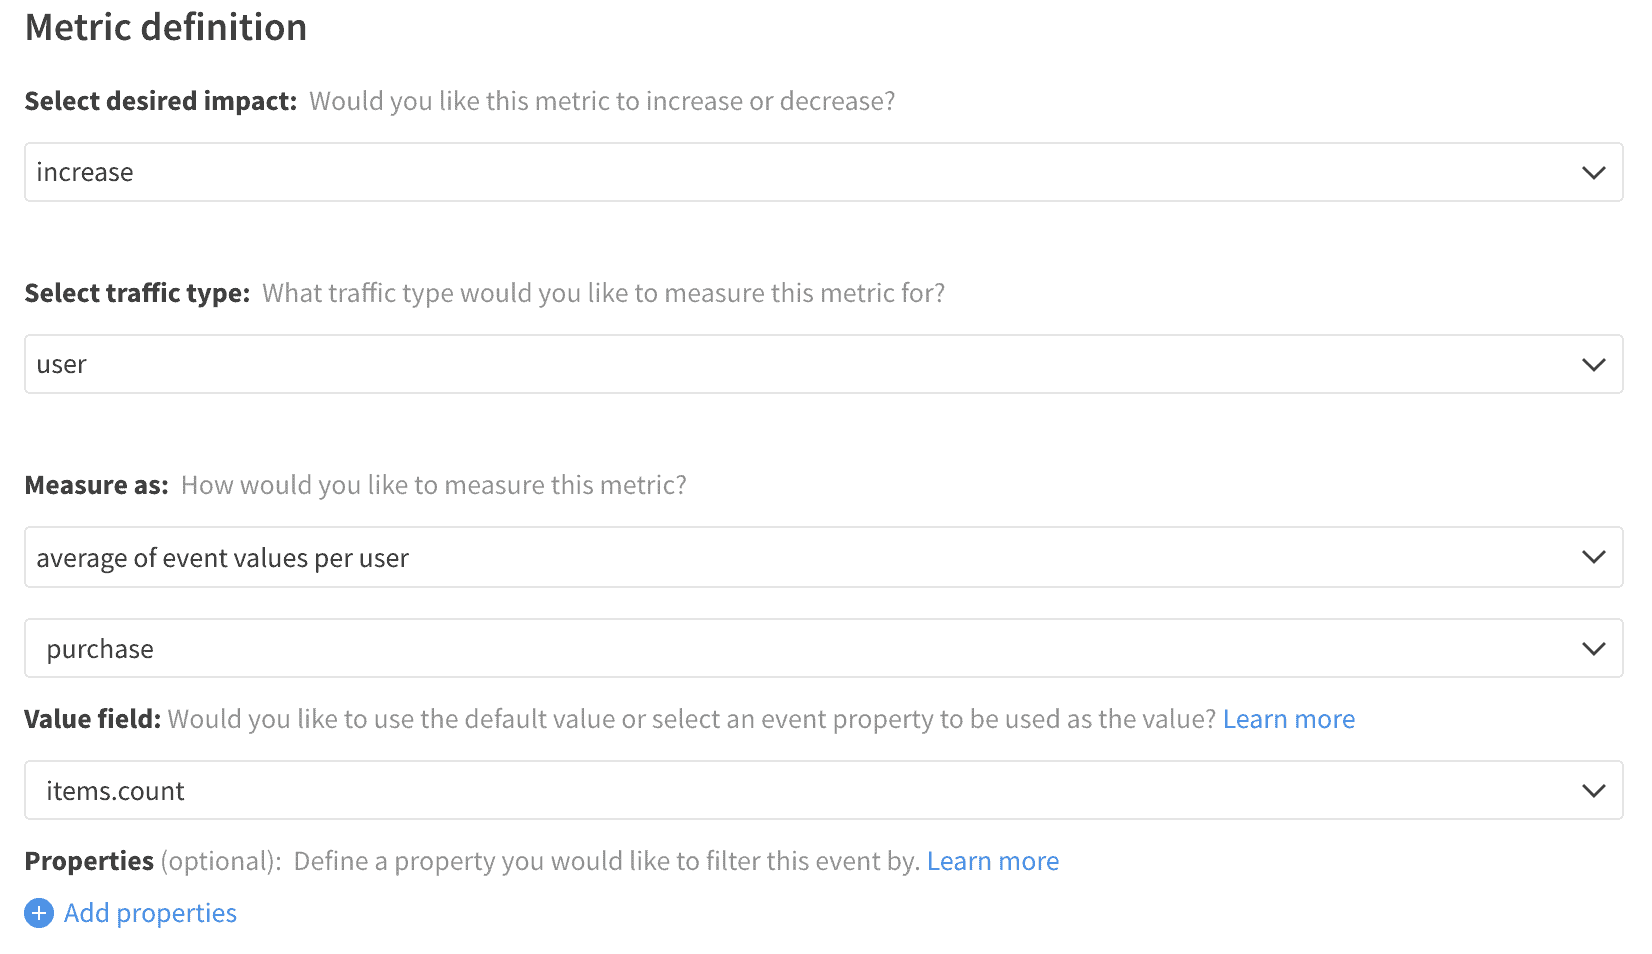
For applications that allow the purchase of multiple items in a single transaction, tracking the number and value of those items as properties of the purchase event can provide valuable context on the goods sold, allowing for tracking the items per purchase. These item purchase metrics tie closely with cart metrics, and the two events are used together when measuring cart completion. A purchase is also an example of a conversion, allowing the flow leading up to the purchase to be analyzed as you would any other conversion funnel.
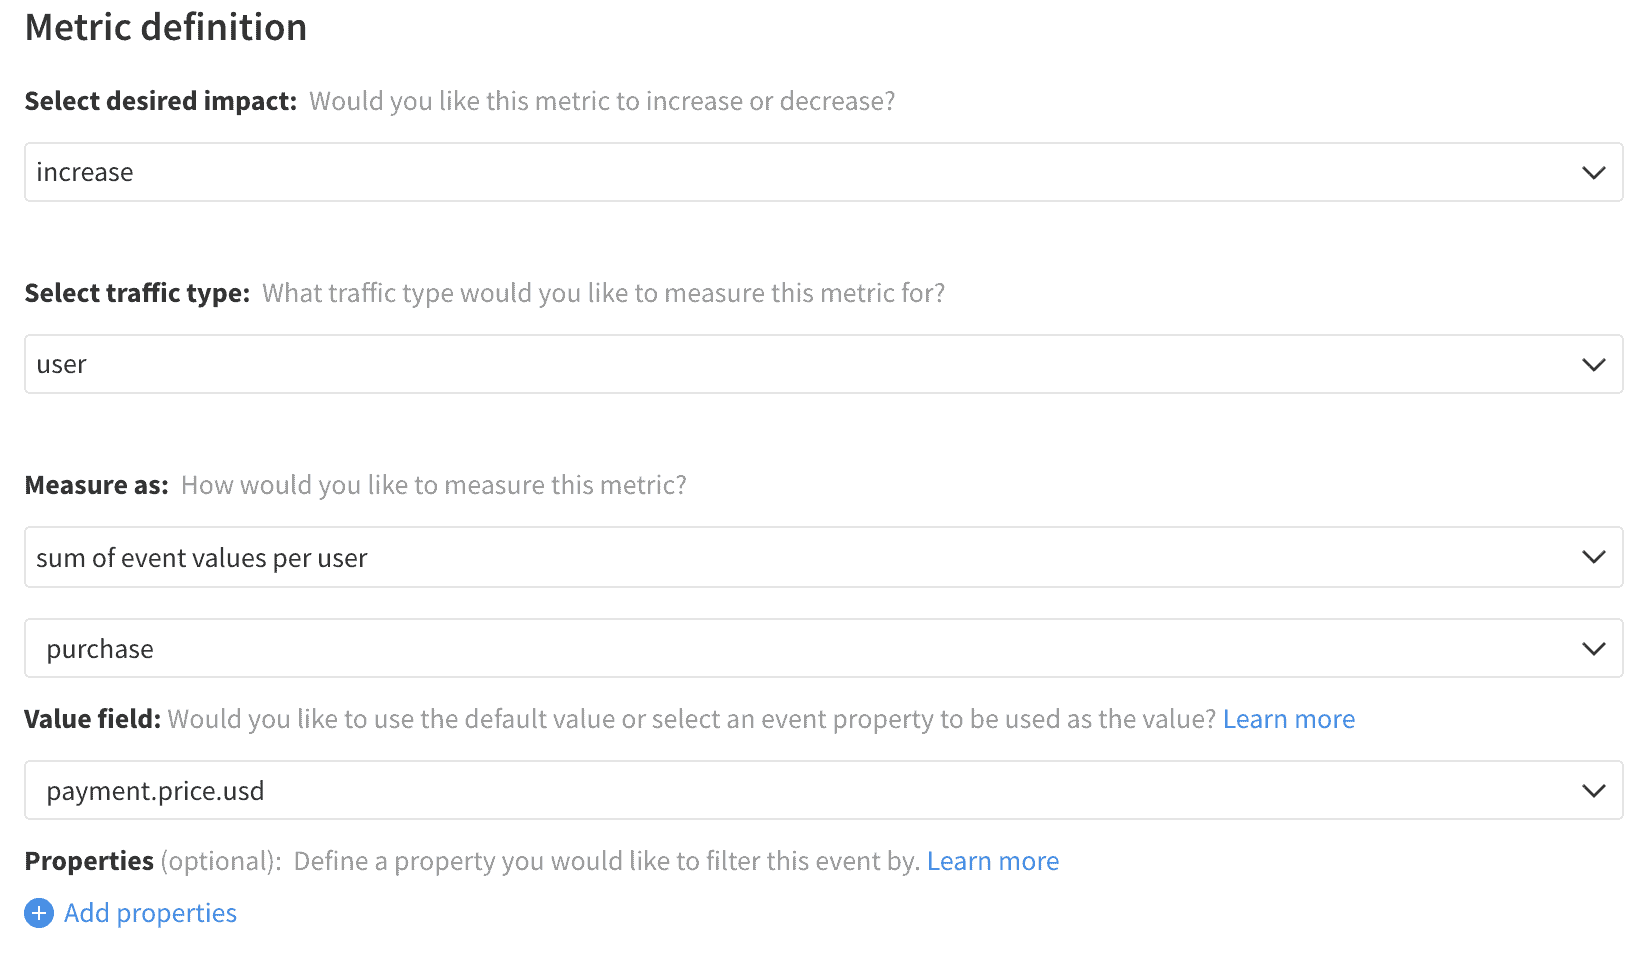
Total Purchase Value
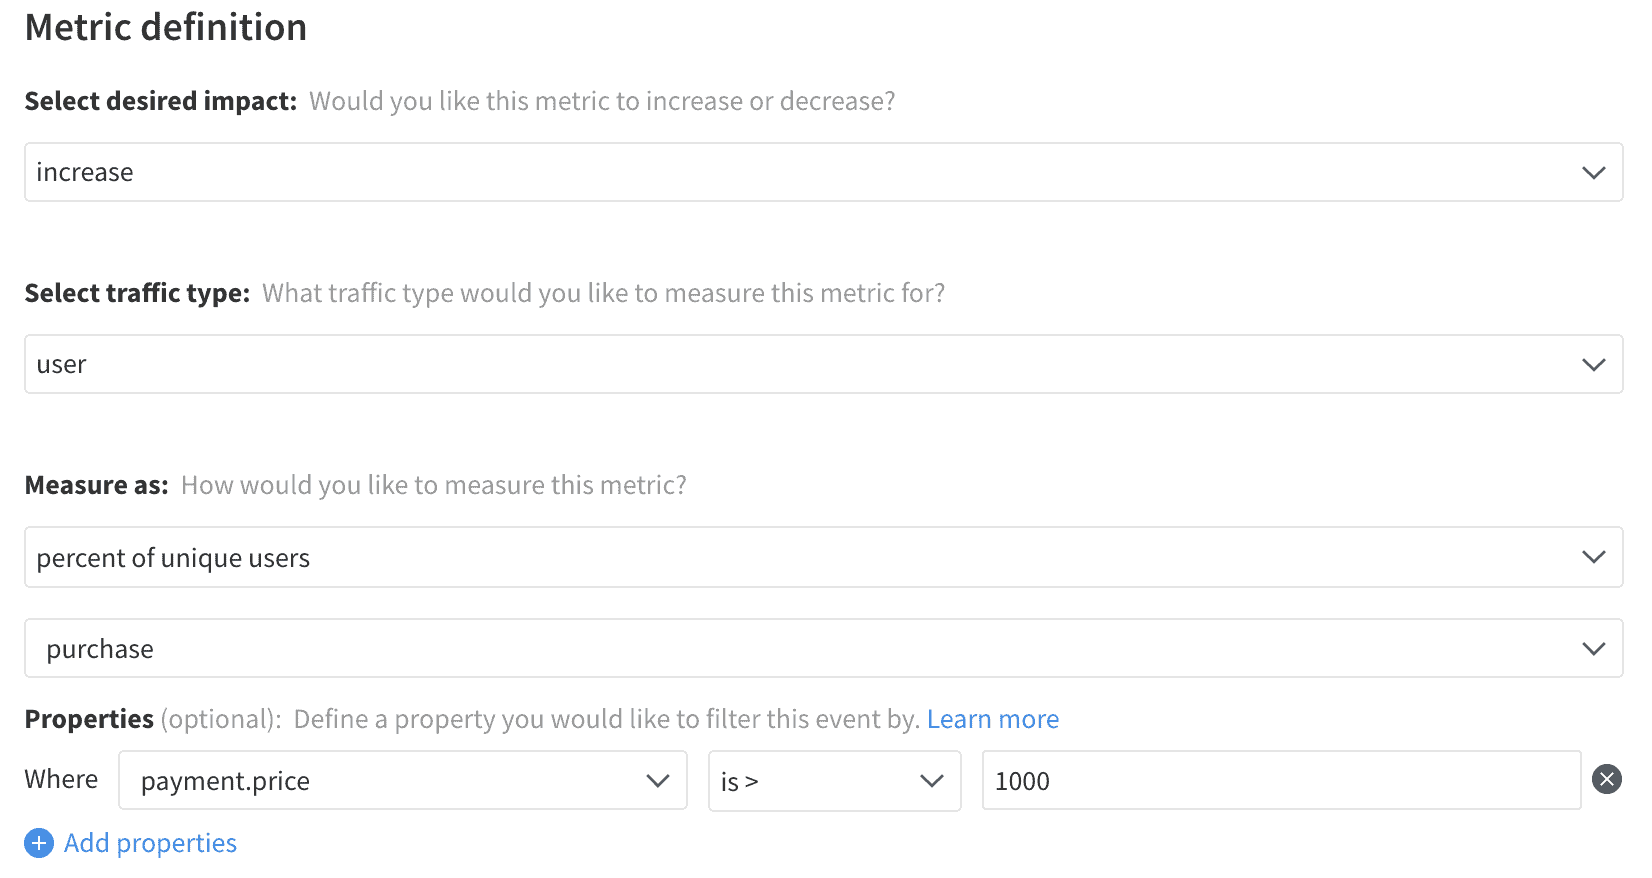
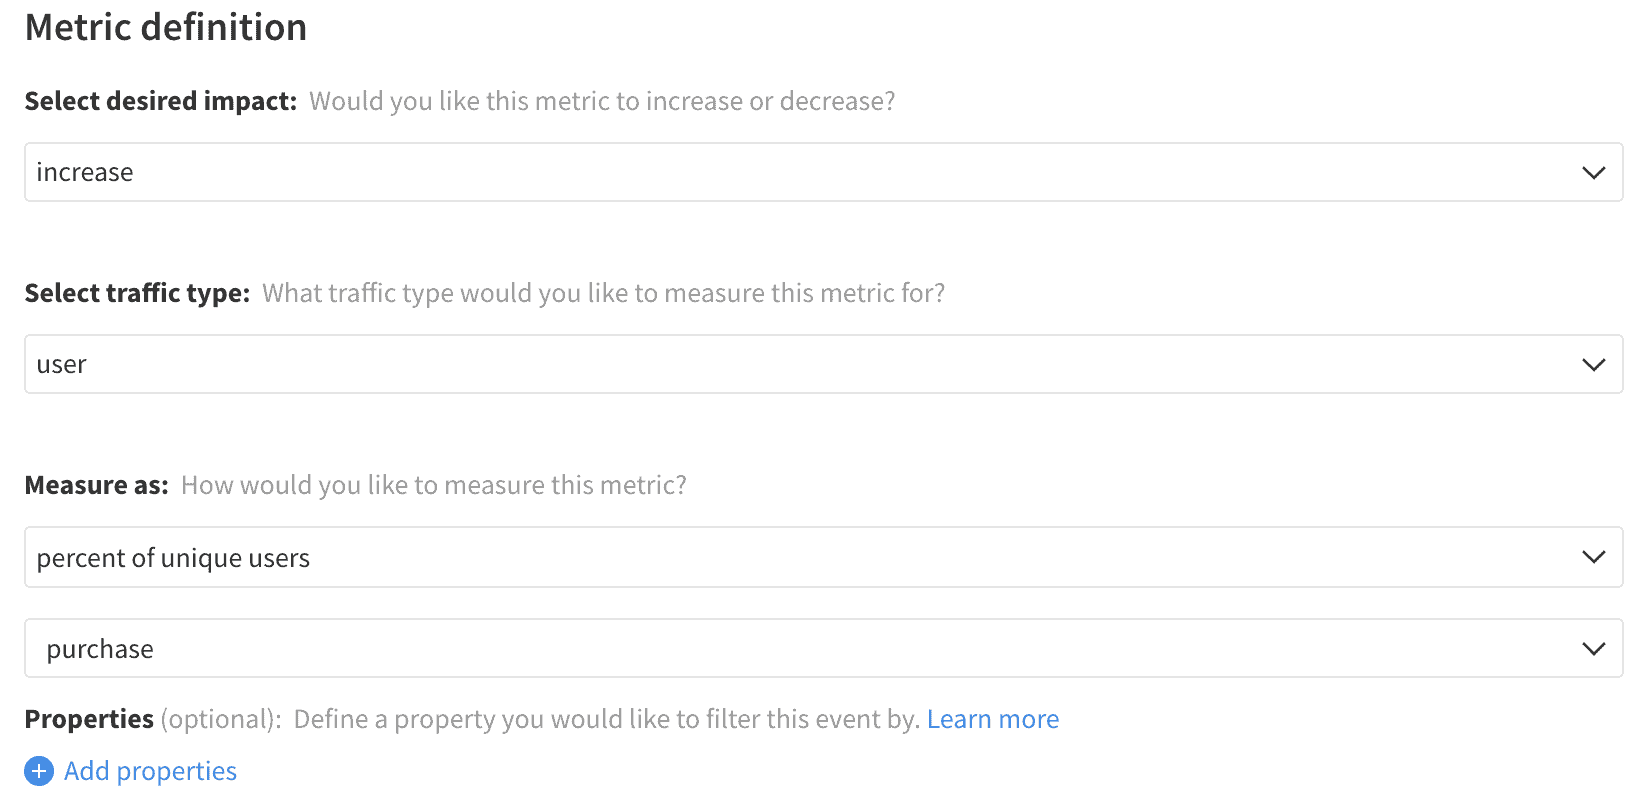
Purchase Rate
Purchase Frequency
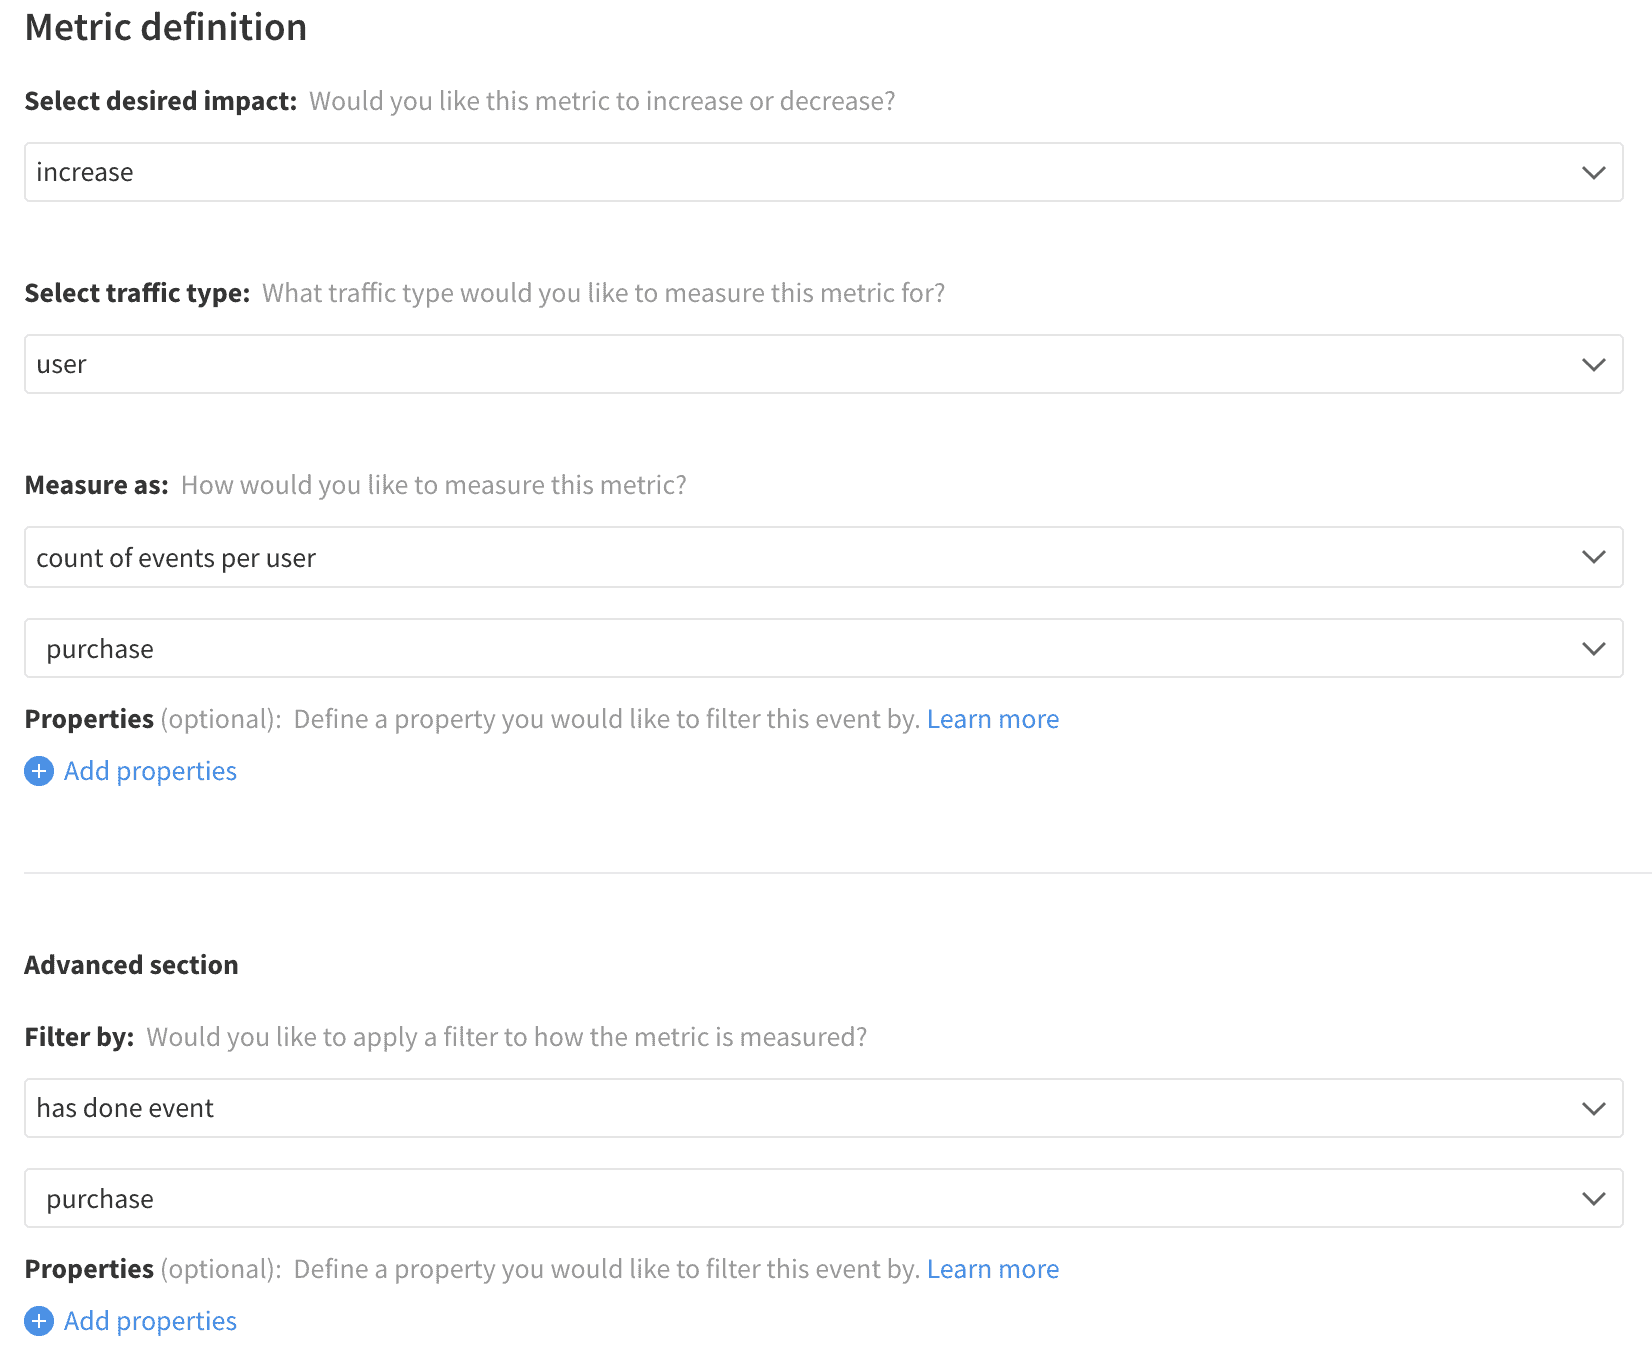
Purchase Count
Average Purchase Value

Items per Purchase
High Value Purchase Rate